Fig. 2
Download original image
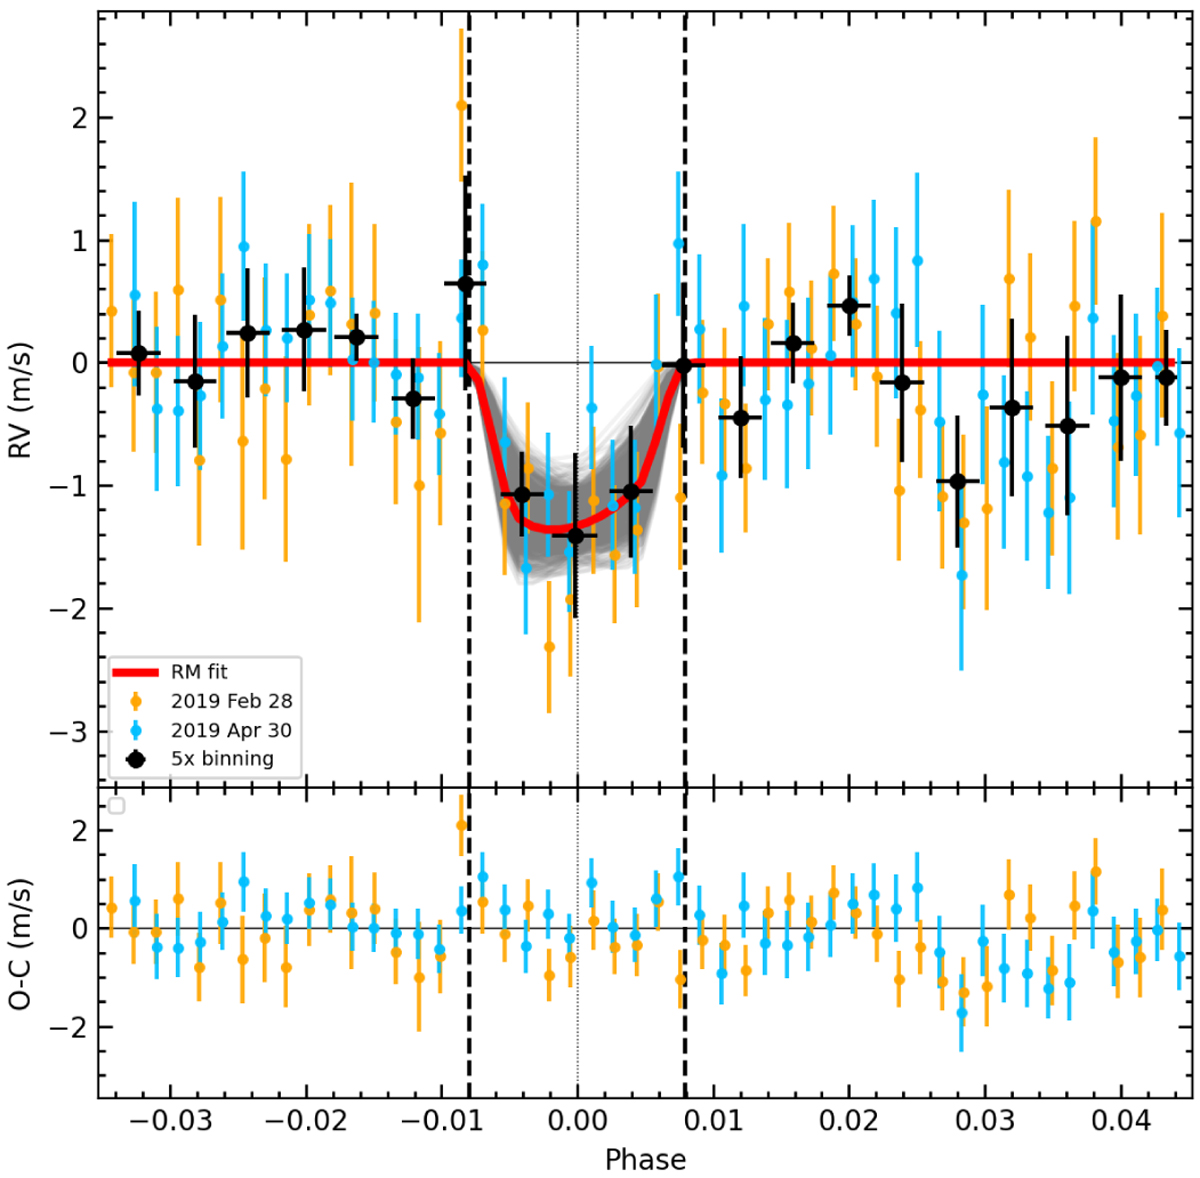
Top: RM anomaly induced by GJ 436 b in the RV residuals measured in Visits 1 (orange) and 2 (blue). Black dots represent a binning of the RV data with a bin size of 2.5 over the combined transits. The red line shows the classical fit to the anomaly, with associated uncertainty depicted by the gray area. Vertical dashed lines indicate the first and fourth transit contacts. Bottom: RV residuals, which display an overall dispersion of 65 cm s−1.
Current usage metrics show cumulative count of Article Views (full-text article views including HTML views, PDF and ePub downloads, according to the available data) and Abstracts Views on Vision4Press platform.
Data correspond to usage on the plateform after 2015. The current usage metrics is available 48-96 hours after online publication and is updated daily on week days.
Initial download of the metrics may take a while.