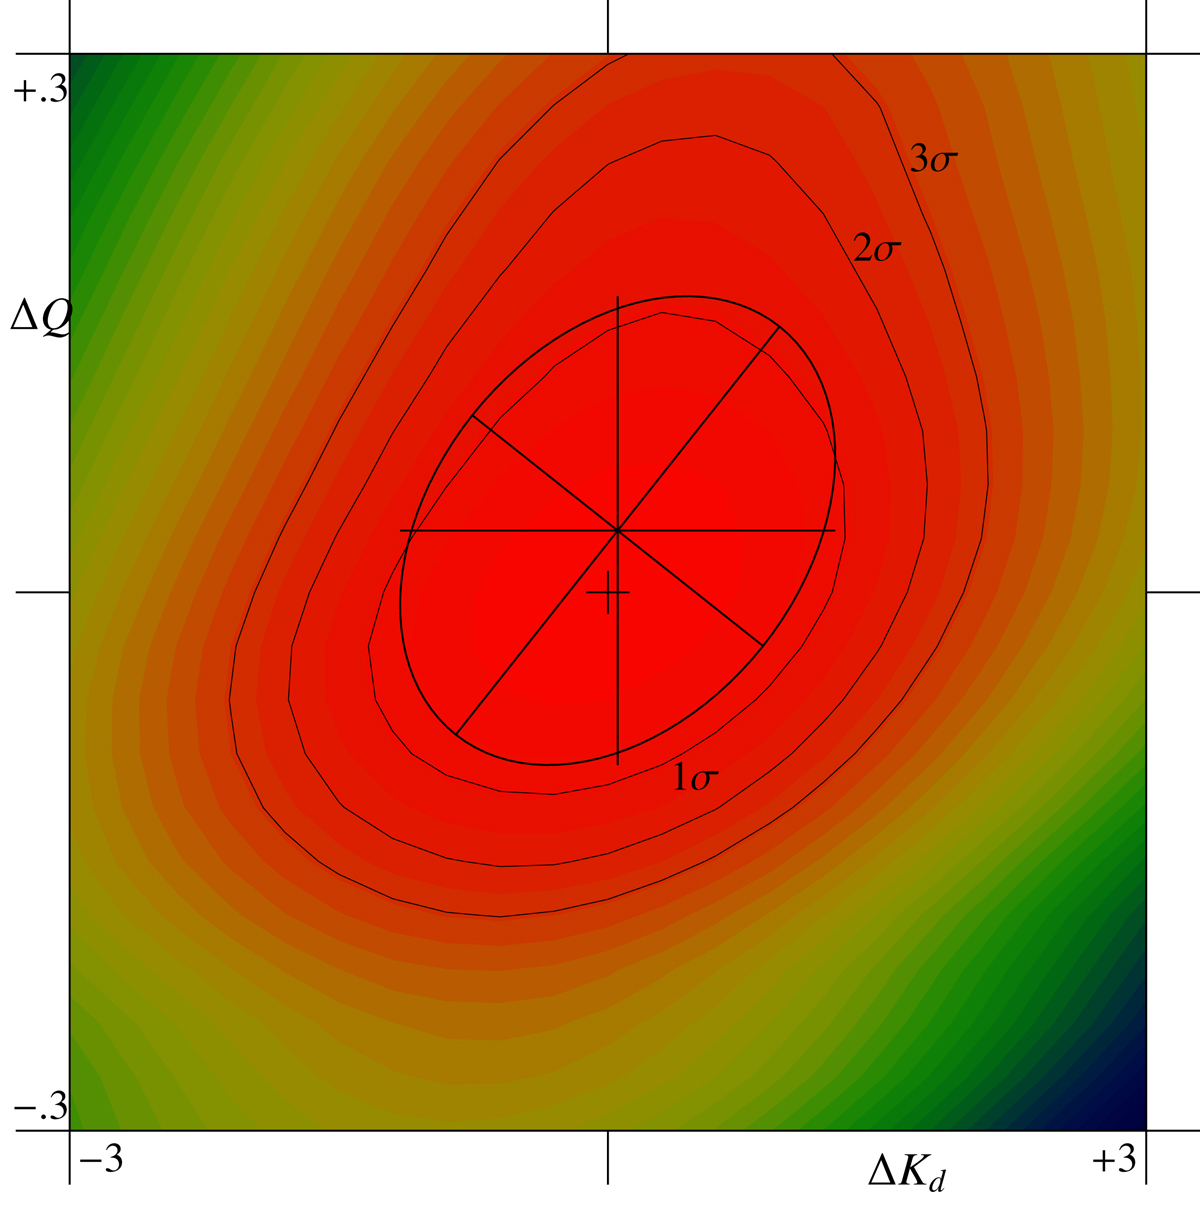
Fig. 5.
Download original image
Probability distribution of Solution 8 in the cross-section of parameters Kd (in km s−1) and Q. The small cross in the centre of the figure corresponds to the highest probability which is in the values given in Table 2, the axes are labeled in differences from these values. The centre of the probability ellipse obtained from the moments of the distribution is shifted to a higher value of Q. The three isolines give limits of 1, 2, and 3-σ probability, which admits even higher values of Q.
Current usage metrics show cumulative count of Article Views (full-text article views including HTML views, PDF and ePub downloads, according to the available data) and Abstracts Views on Vision4Press platform.
Data correspond to usage on the plateform after 2015. The current usage metrics is available 48-96 hours after online publication and is updated daily on week days.
Initial download of the metrics may take a while.