Free Access
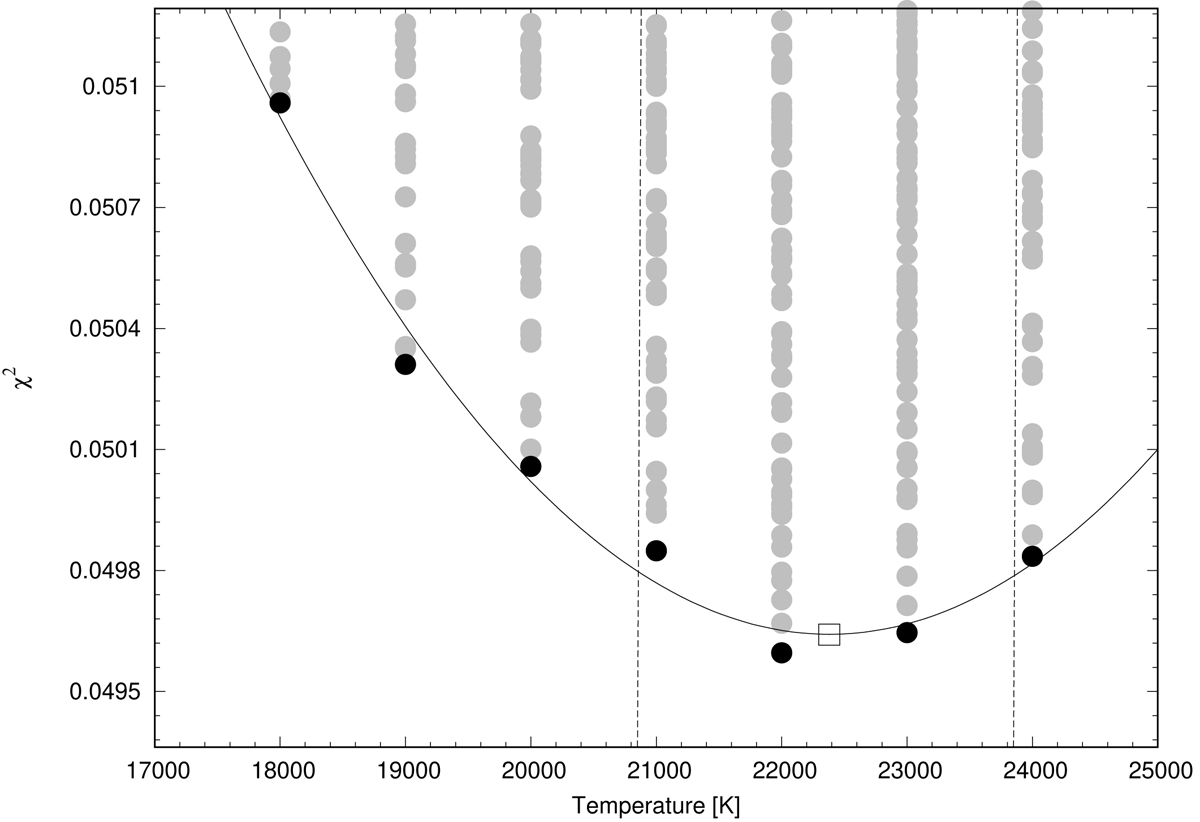
Fig. 19.
Download original image
Distribution of χ2 of the fitting for effective temperature. Black dots mark the minimal value for each temperature, gray dots show residuals for all fits, solid black line displays the quadratic fit to the infima, dashed black lines border the interval with 1σ confidence level, and the black square is the best value.
Current usage metrics show cumulative count of Article Views (full-text article views including HTML views, PDF and ePub downloads, according to the available data) and Abstracts Views on Vision4Press platform.
Data correspond to usage on the plateform after 2015. The current usage metrics is available 48-96 hours after online publication and is updated daily on week days.
Initial download of the metrics may take a while.