Open Access
Fig. 8
Download original image
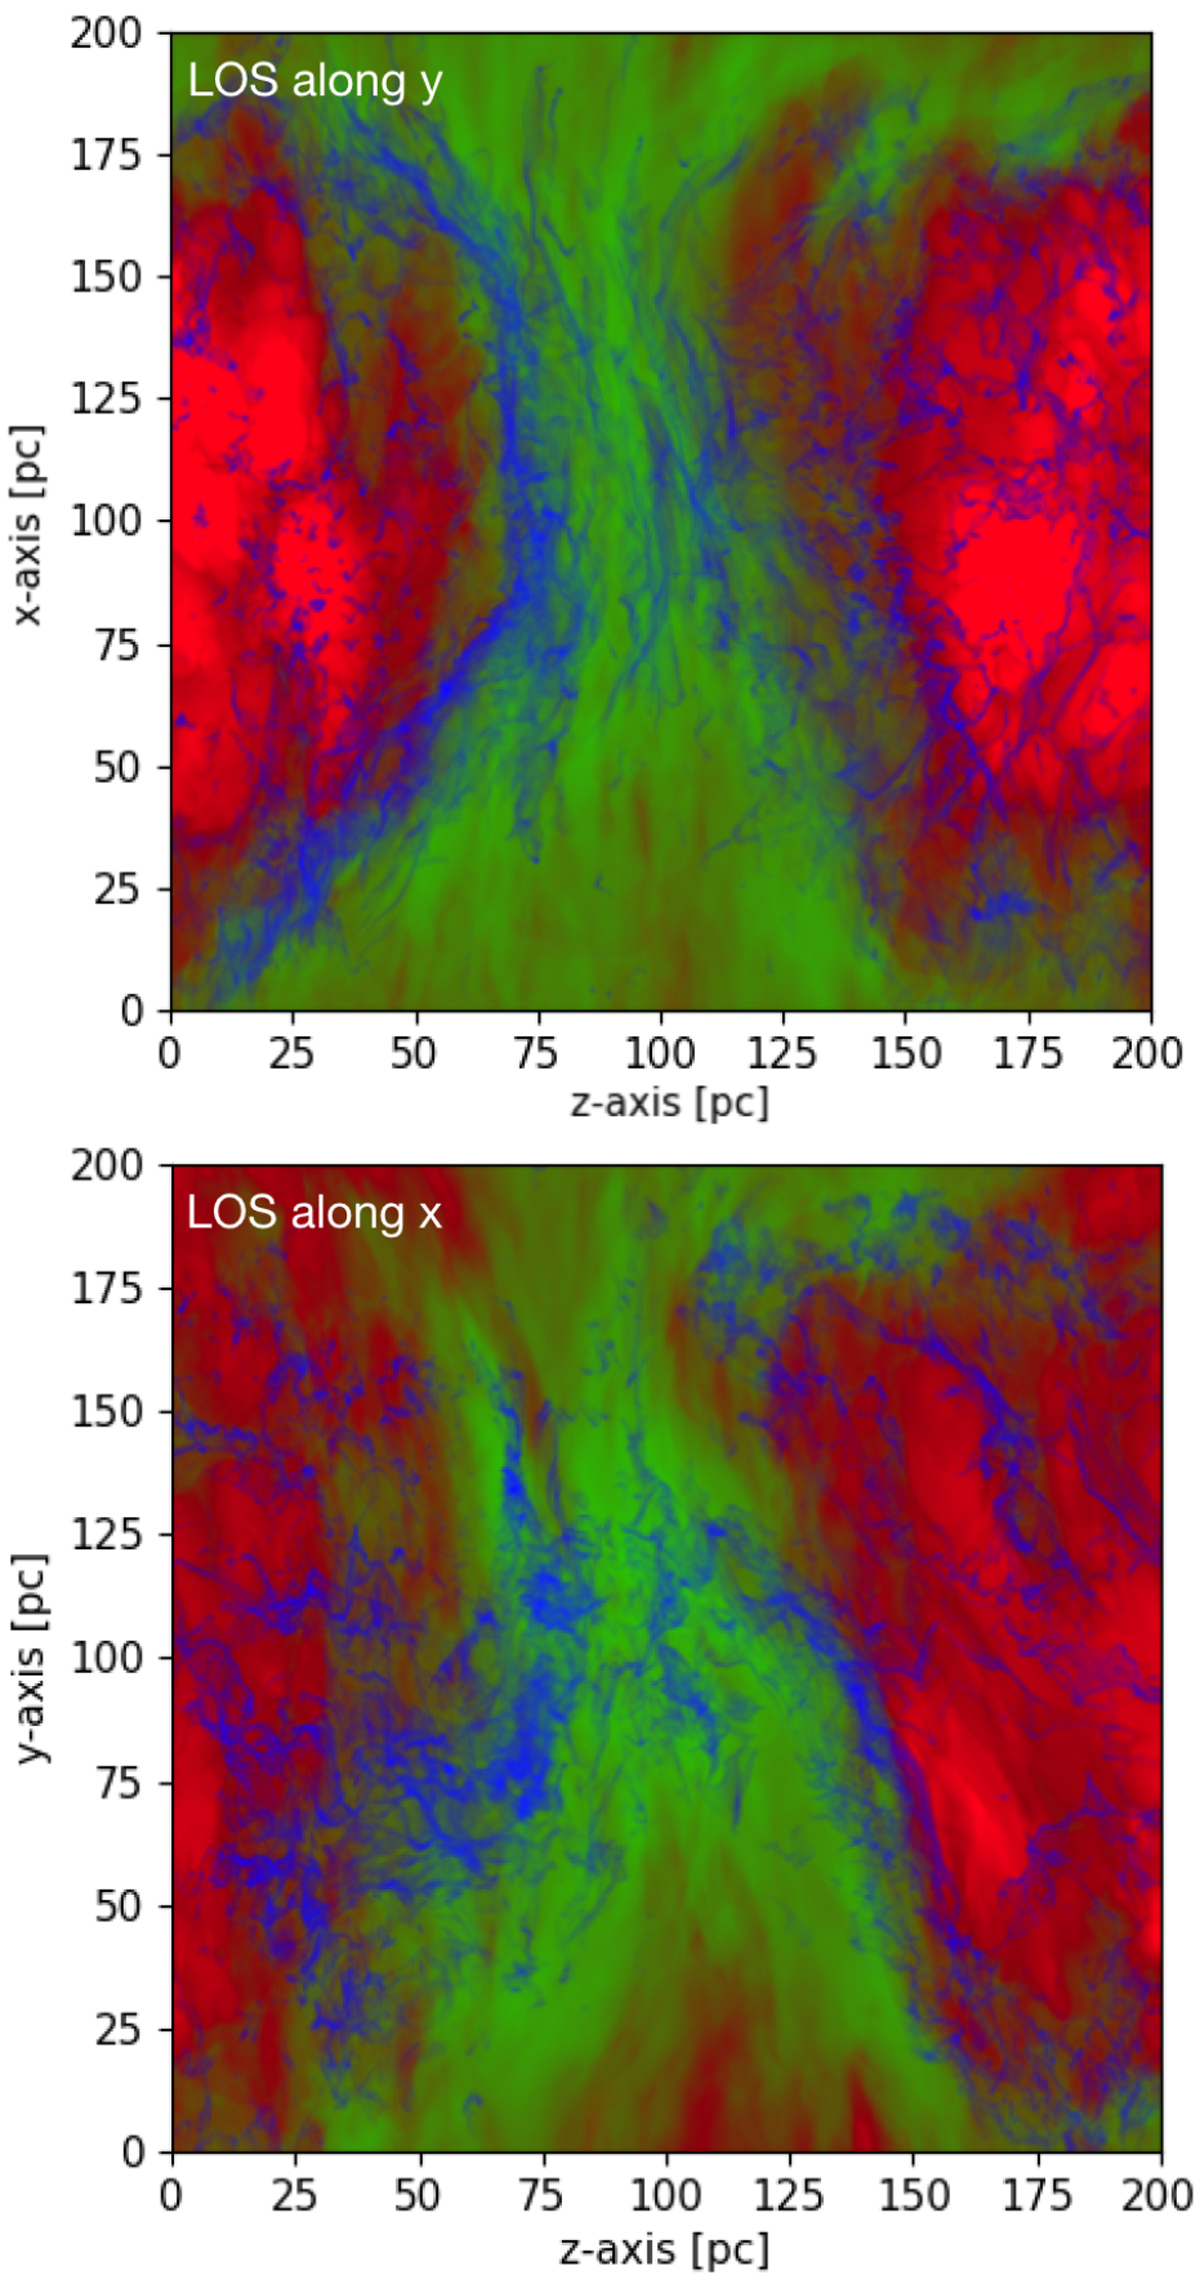
RGB images showing the contribution to the column density structure of the cold phases (blue, CNM + LNM), the warm and partially ionized phases (green, WNM + WPIM), and the fully ionized phase (red, FIM) as defined in Table 3. Two different LOS for case A are shown.
Current usage metrics show cumulative count of Article Views (full-text article views including HTML views, PDF and ePub downloads, according to the available data) and Abstracts Views on Vision4Press platform.
Data correspond to usage on the plateform after 2015. The current usage metrics is available 48-96 hours after online publication and is updated daily on week days.
Initial download of the metrics may take a while.