Fig. 3
Download original image
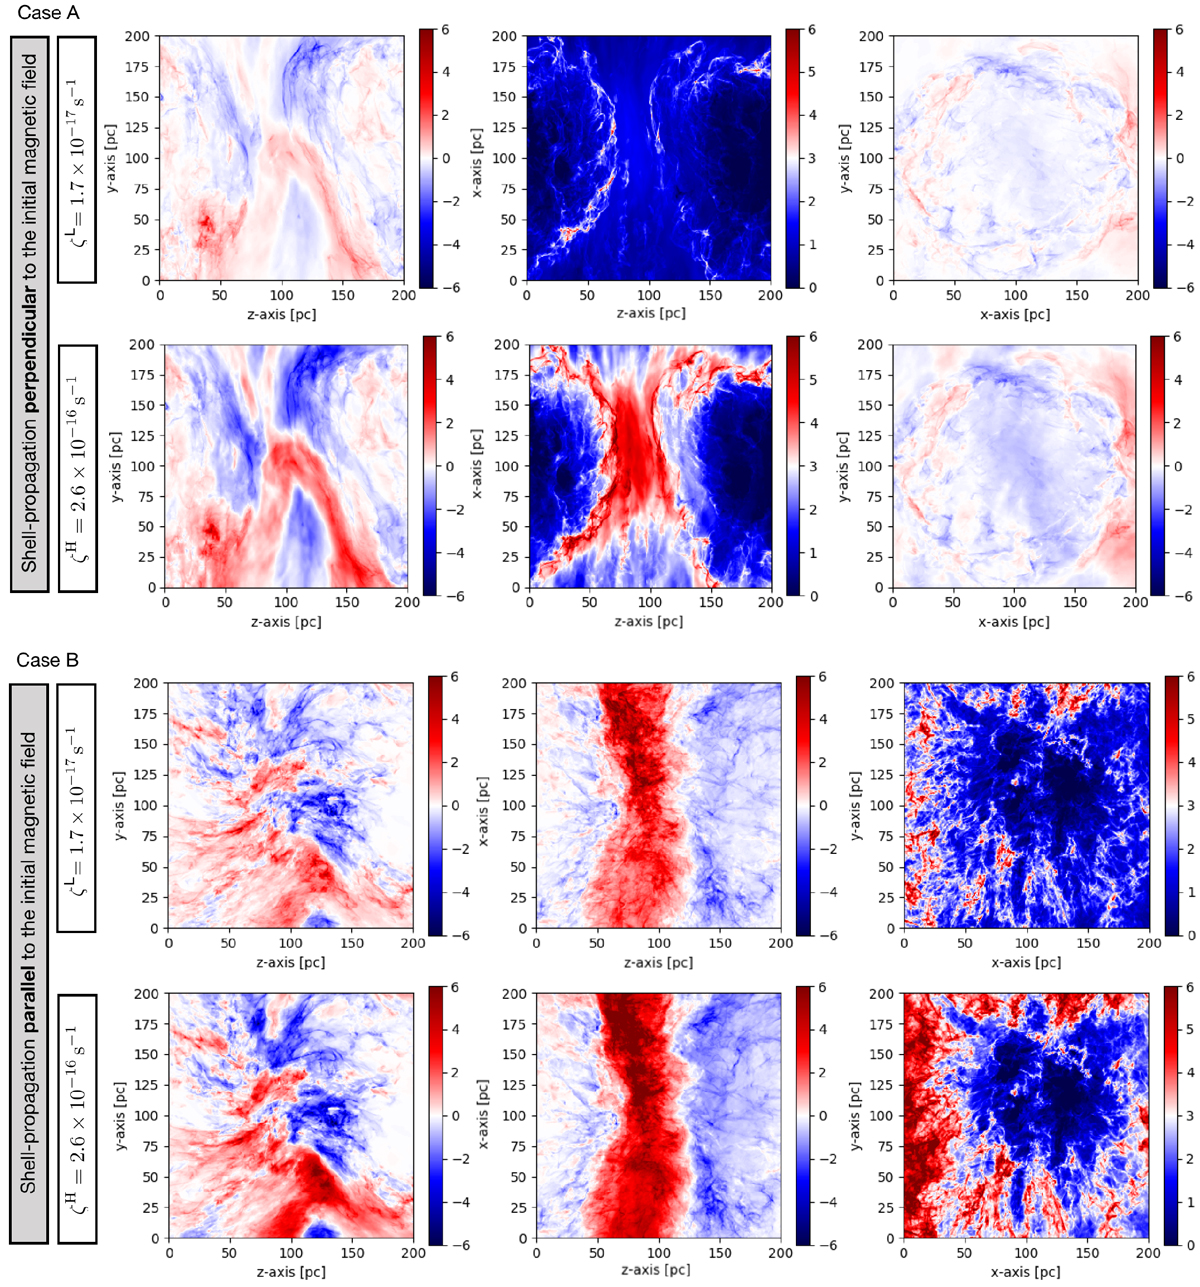
Maps of rotation measure (RM) in units of rad m−2 obtained within the full length of the simulated cube for cases A and B with two amounts of ionization rates (ζ, see encapsulated panels on the left). The LOS changes along the x or y or z axes going from left to right, respectively. The dynamic range of the color bars is only positive when the integration axis is along the mean magnetic-field orientation (central panels in the first two rows from the top and right panels in the two bottom rows).
Current usage metrics show cumulative count of Article Views (full-text article views including HTML views, PDF and ePub downloads, according to the available data) and Abstracts Views on Vision4Press platform.
Data correspond to usage on the plateform after 2015. The current usage metrics is available 48-96 hours after online publication and is updated daily on week days.
Initial download of the metrics may take a while.