Open Access
Fig. B.2
Download original image
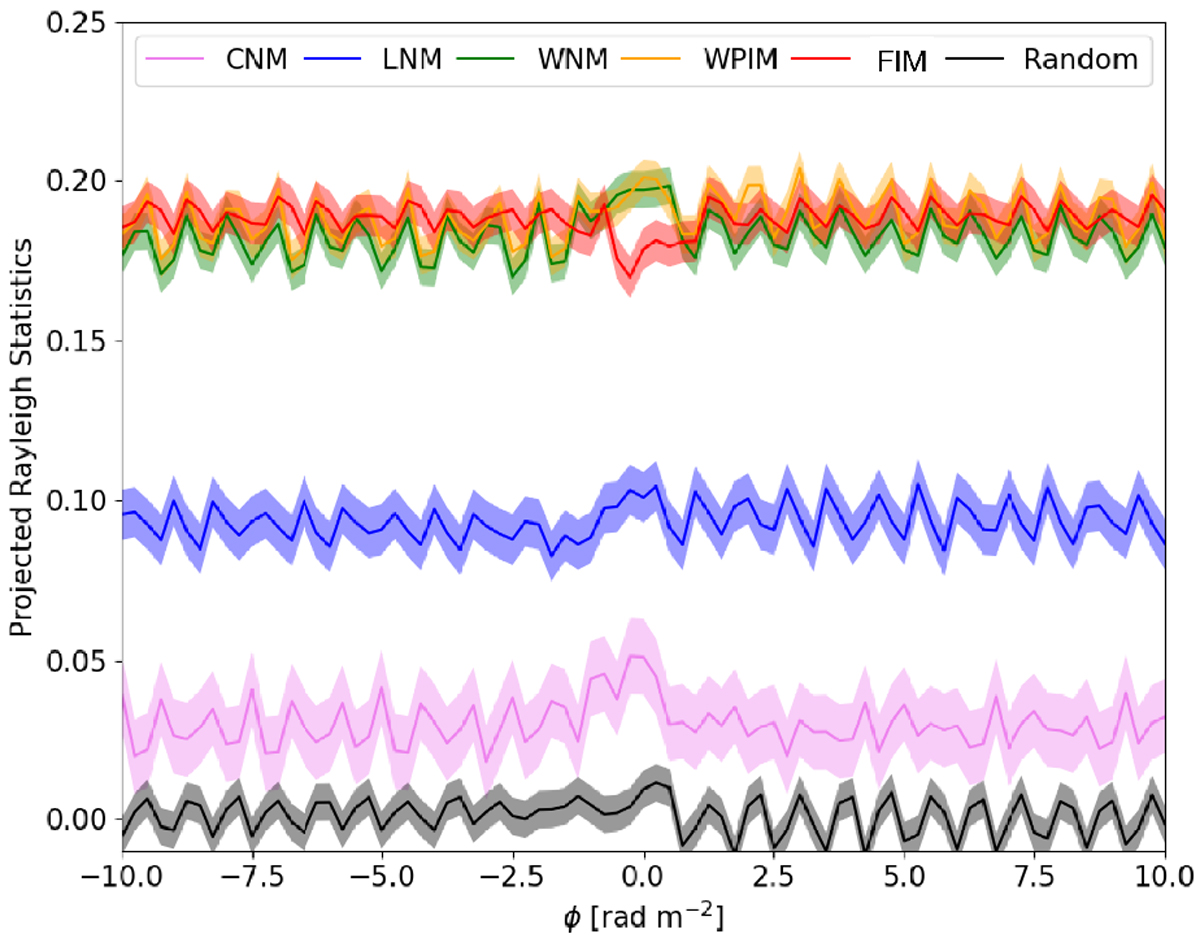
Correlation analysis between PIϕ and NH as in Fig. 15 but without normalizing the V parameter from HOG to the ratio between the maximum value of PIϕ at a given slice in the Faraday cube and the maximum value of the full Faraday tomographic cube.
Current usage metrics show cumulative count of Article Views (full-text article views including HTML views, PDF and ePub downloads, according to the available data) and Abstracts Views on Vision4Press platform.
Data correspond to usage on the plateform after 2015. The current usage metrics is available 48-96 hours after online publication and is updated daily on week days.
Initial download of the metrics may take a while.