Open Access
Fig. A.1
Download original image
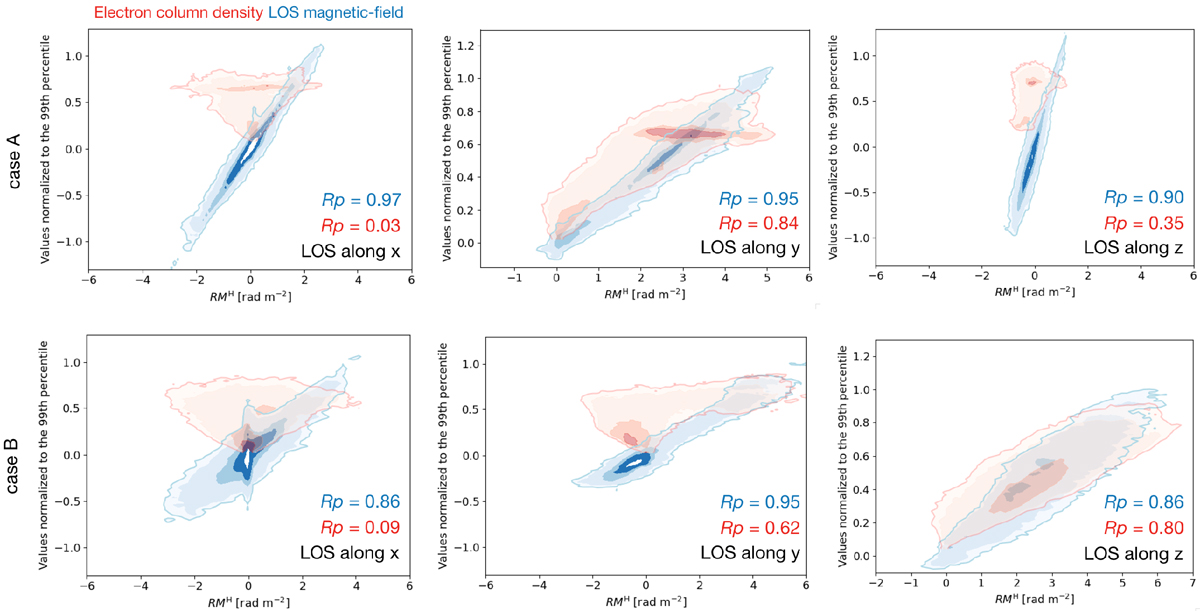
2D histograms showing the correlation between RMH and the maps of the LOS-average magnetic field (blue) and the electron column density (red) as in Fig. 6 but for lines of sight (LOS) along the x and z axes for case A (top row) and for all LOS axes for case B (bottom row).
Current usage metrics show cumulative count of Article Views (full-text article views including HTML views, PDF and ePub downloads, according to the available data) and Abstracts Views on Vision4Press platform.
Data correspond to usage on the plateform after 2015. The current usage metrics is available 48-96 hours after online publication and is updated daily on week days.
Initial download of the metrics may take a while.