Open Access
Fig. 16
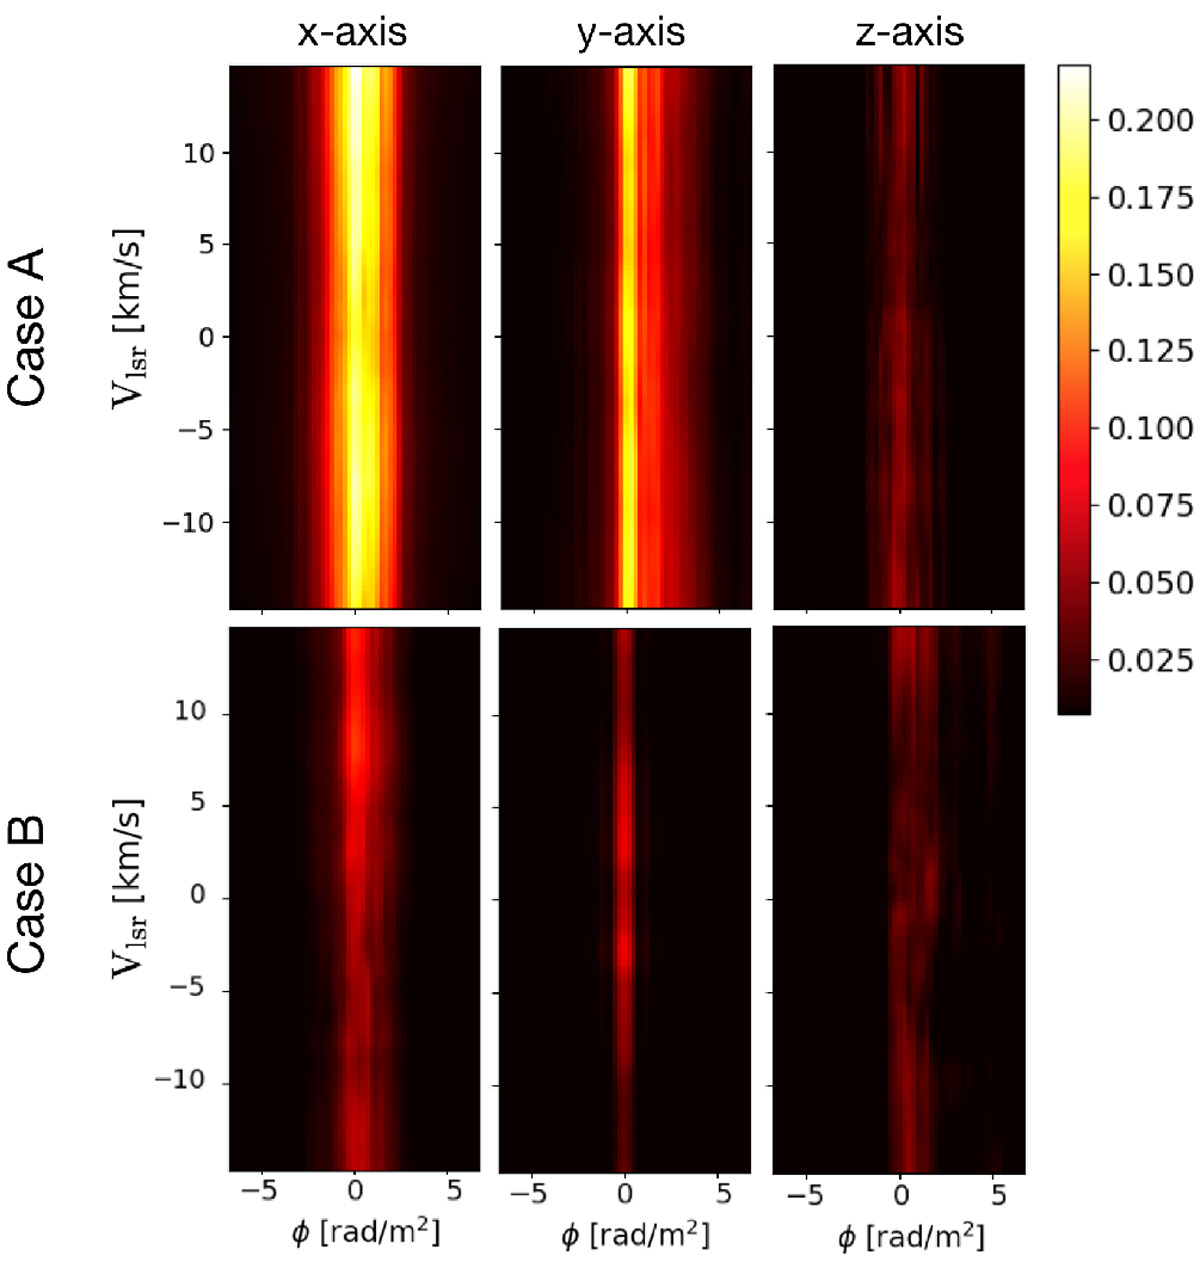
Download original image
Normalized V parameter from HOG between synthetic maps of the PI as a function of ϕ and of the HI brightness temperature, Tb, as a function of Vlsr. The corresponding LOS integration axis and physical scenario are labeled. The color scale is the same for all panels.
Current usage metrics show cumulative count of Article Views (full-text article views including HTML views, PDF and ePub downloads, according to the available data) and Abstracts Views on Vision4Press platform.
Data correspond to usage on the plateform after 2015. The current usage metrics is available 48-96 hours after online publication and is updated daily on week days.
Initial download of the metrics may take a while.