Open Access
Fig. 15
Download original image
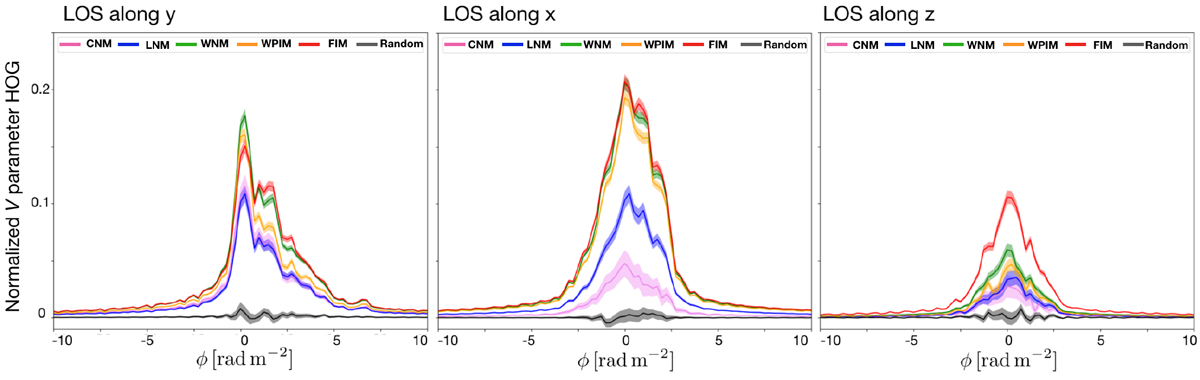
Correlation analysis between PIϕ and the NH maps of each different gas phase (see the encapsulated legend) based on the projected Rayleigh statistics obtained with HOG. As a reference, the correlation with a random map is also shown in black. Three different LOS of case A are shown.
Current usage metrics show cumulative count of Article Views (full-text article views including HTML views, PDF and ePub downloads, according to the available data) and Abstracts Views on Vision4Press platform.
Data correspond to usage on the plateform after 2015. The current usage metrics is available 48-96 hours after online publication and is updated daily on week days.
Initial download of the metrics may take a while.