Fig. 1
Download original image
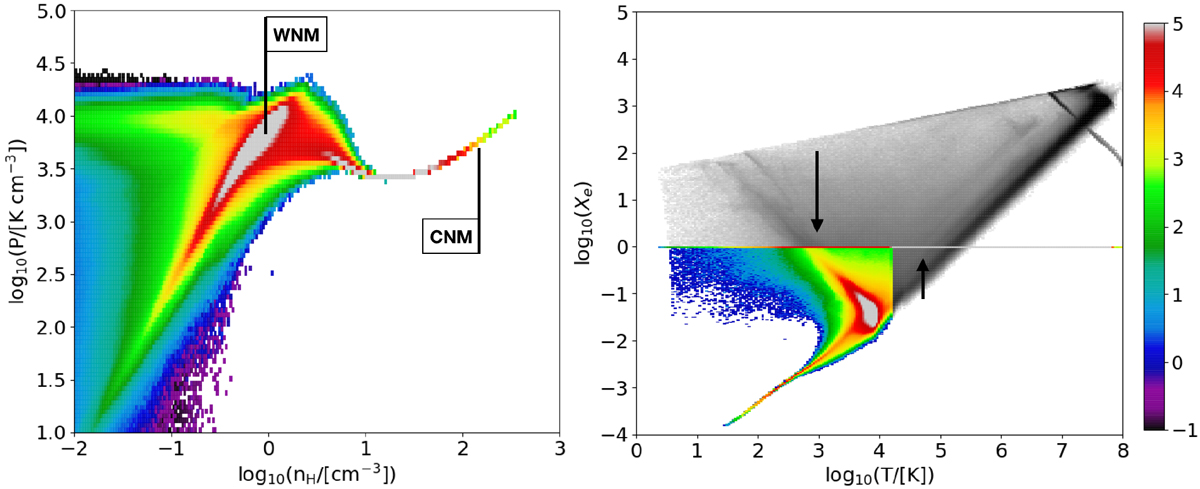
Phase diagrams. Left panel: Phase diagram (pressure, P, vs. gas density, nH) of case A. The WNM and CNM regions are labeled. Right panel: Dependence of the ionization fraction, Xe, obtained with Eq. (6), vs the gas temperature, T. Here, the CR ionization rate is set to the value of ζH (see Sect. 2.4). Colors in both panels correspond to the log10 of the density of points as shown by the same color bar on the right. The gray part of the right-panel plot shows the voxels that were artificially set to Xe = 1 (see the two black arrows) as they strongly depart from the assumptions that justify the use of Eq. (6). See main text for details.
Current usage metrics show cumulative count of Article Views (full-text article views including HTML views, PDF and ePub downloads, according to the available data) and Abstracts Views on Vision4Press platform.
Data correspond to usage on the plateform after 2015. The current usage metrics is available 48-96 hours after online publication and is updated daily on week days.
Initial download of the metrics may take a while.