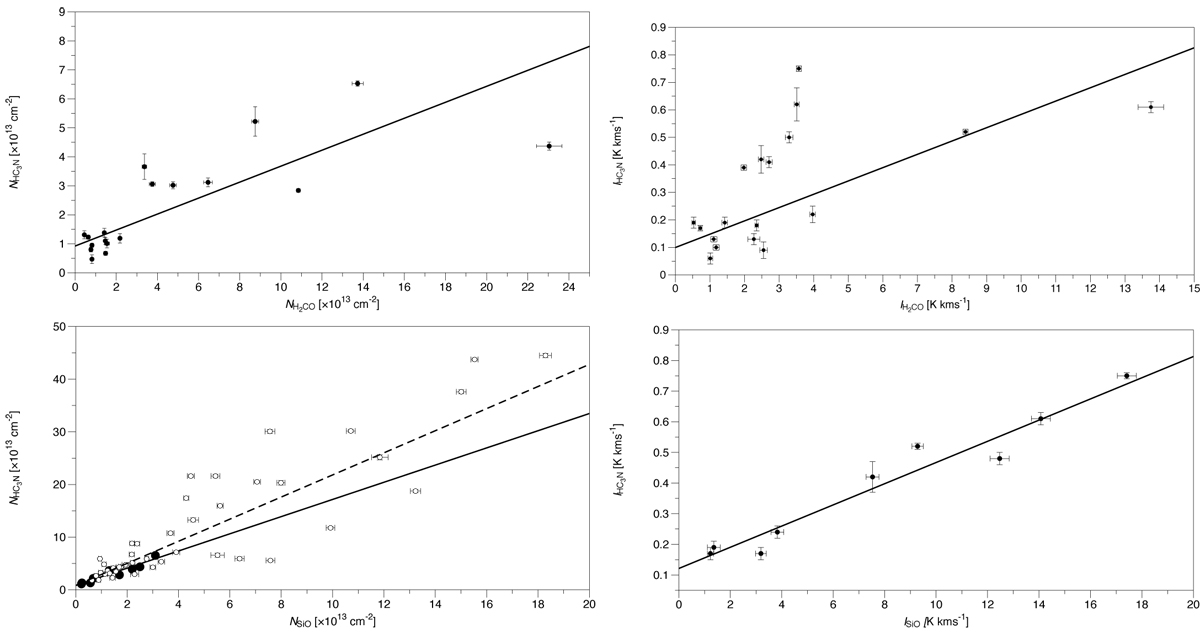
Fig. 5
Download original image
Column density (left panels) and the integrated line intensity (right panels) of HC3N are plotted against those of shock-tracing molecules (H2CO and SiO). The circles and empty circles indicate our sources and sources reported in He et al. (2021), respectively. The solid lines and the dashed line show the weighted linear fitting line for our data and theirs.
Current usage metrics show cumulative count of Article Views (full-text article views including HTML views, PDF and ePub downloads, according to the available data) and Abstracts Views on Vision4Press platform.
Data correspond to usage on the plateform after 2015. The current usage metrics is available 48-96 hours after online publication and is updated daily on week days.
Initial download of the metrics may take a while.