Open Access
Fig. 3
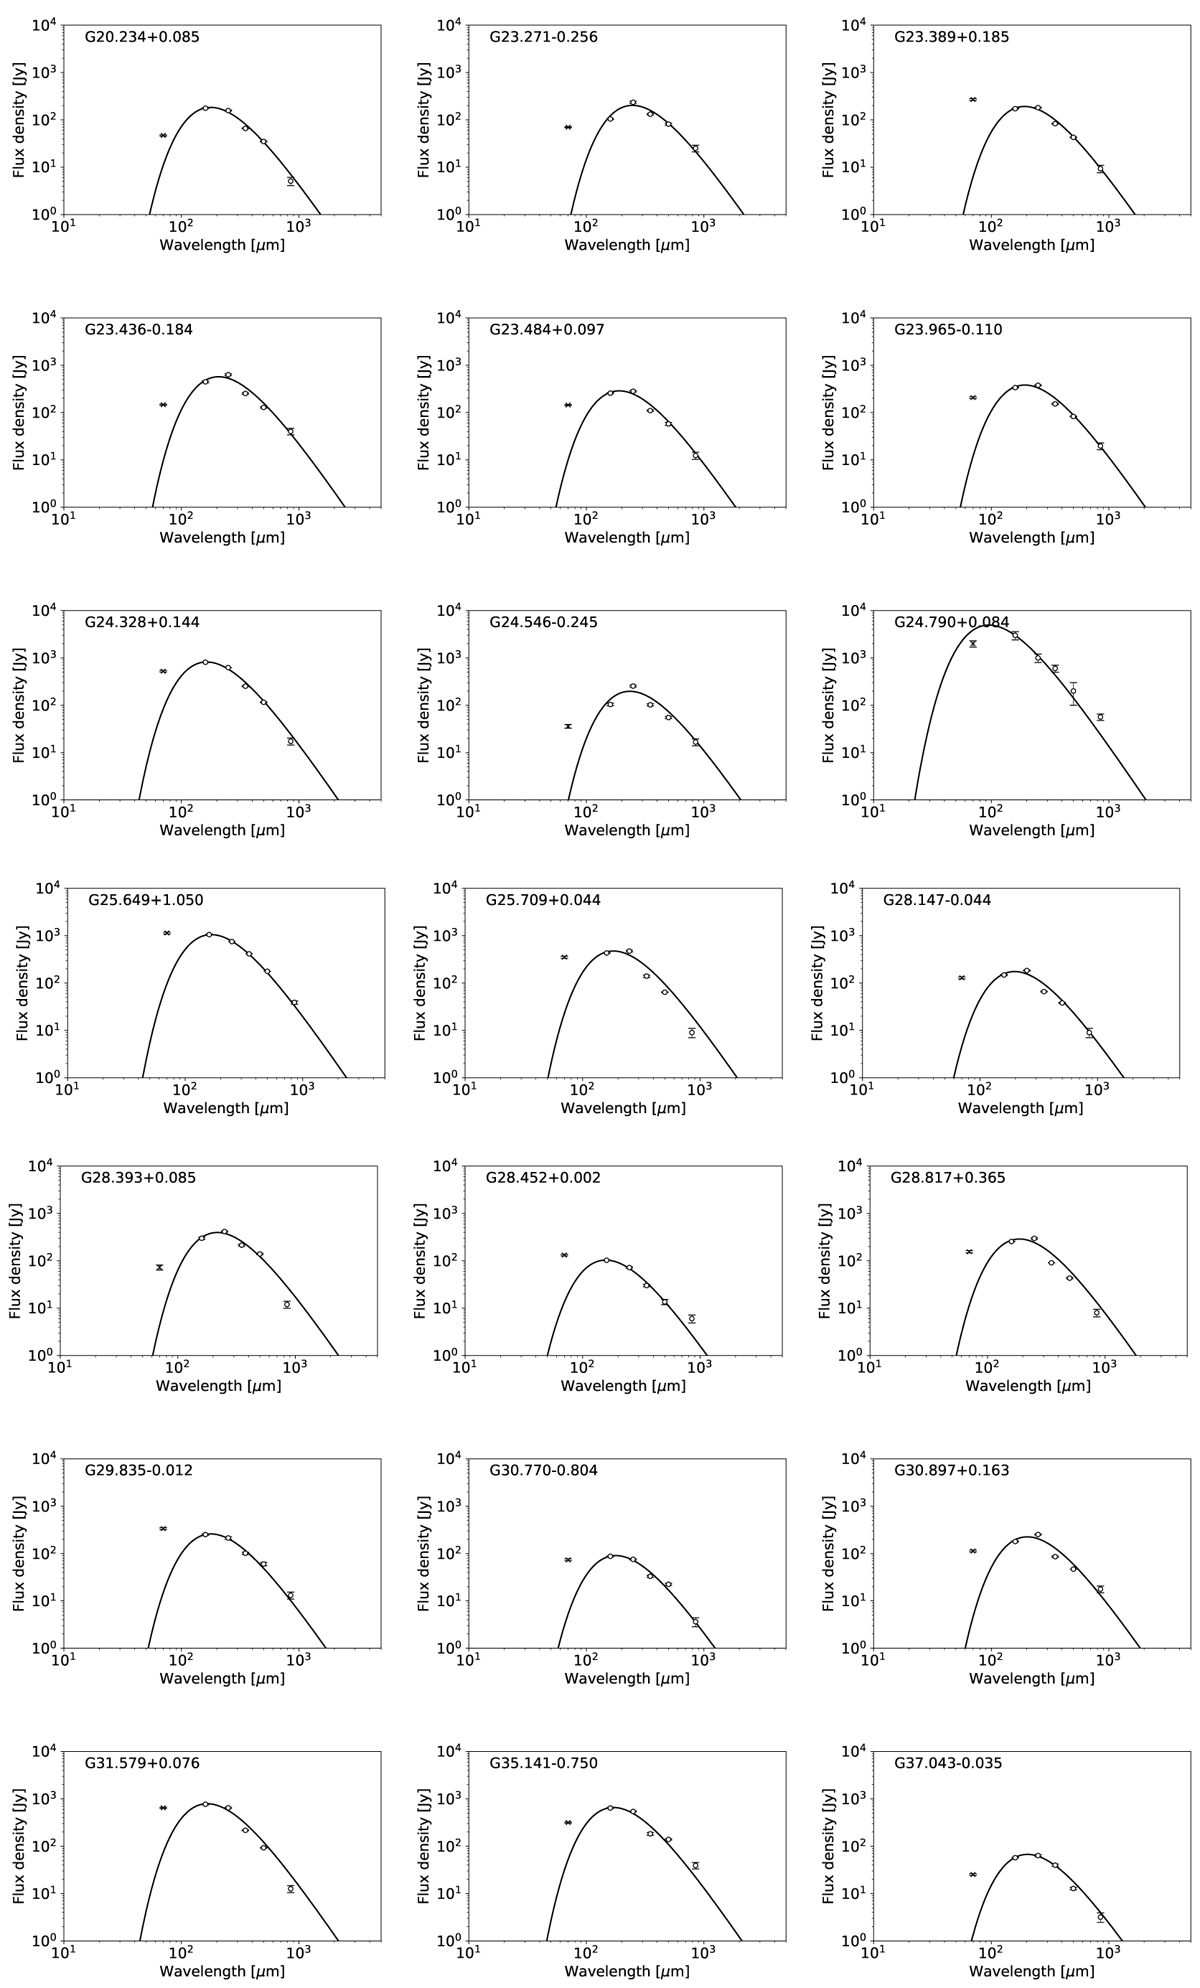
Download original image
FIR SED and its fit curve (the solid curve, from one single temperature grey-body model) of sources with cyanopolyynes detection. The cross indicates 70 µm emission, which is not involved in the SED fit.
Current usage metrics show cumulative count of Article Views (full-text article views including HTML views, PDF and ePub downloads, according to the available data) and Abstracts Views on Vision4Press platform.
Data correspond to usage on the plateform after 2015. The current usage metrics is available 48-96 hours after online publication and is updated daily on week days.
Initial download of the metrics may take a while.