Fig. 14
Download original image
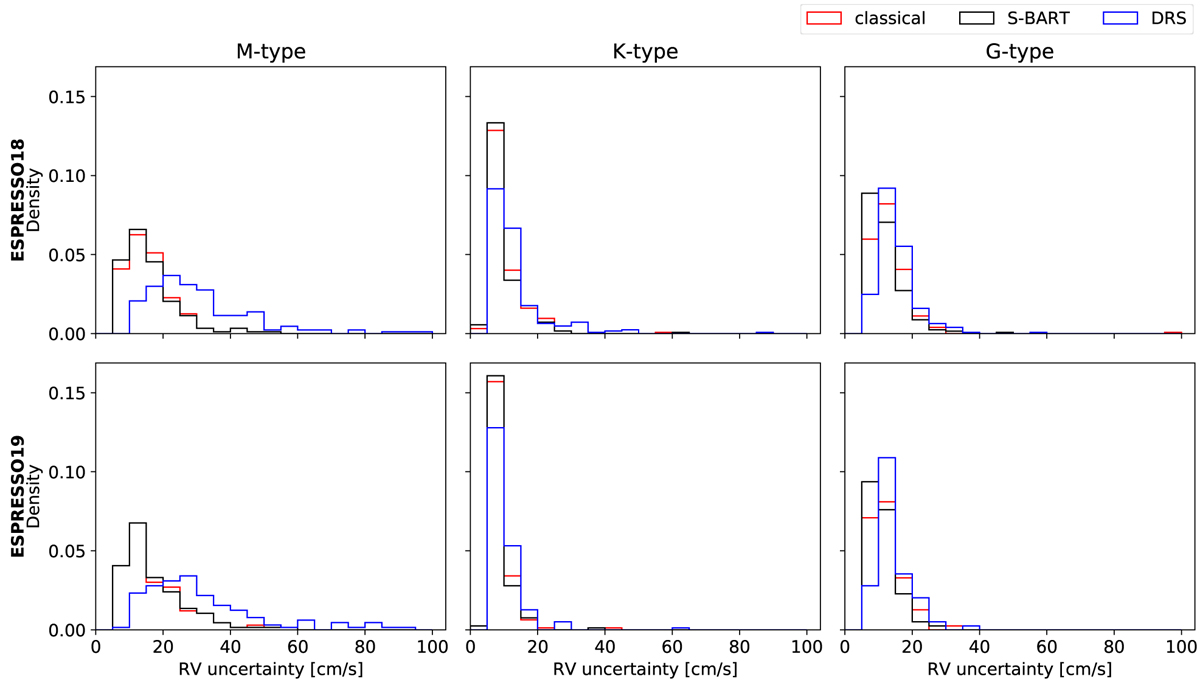
Comparison of the RV uncertainties obtained for all ESPRESS018 (top panel) and ESPRESS019 (bottom panel) observations used in Fig. 13, separated by spectral type. The RV uncertainty estimated by the DRS is shown in blue while those estimated through the S-BART and classical methodologies are shown in black and red, respectively.
Current usage metrics show cumulative count of Article Views (full-text article views including HTML views, PDF and ePub downloads, according to the available data) and Abstracts Views on Vision4Press platform.
Data correspond to usage on the plateform after 2015. The current usage metrics is available 48-96 hours after online publication and is updated daily on week days.
Initial download of the metrics may take a while.