Open Access
Fig. 12
Download original image
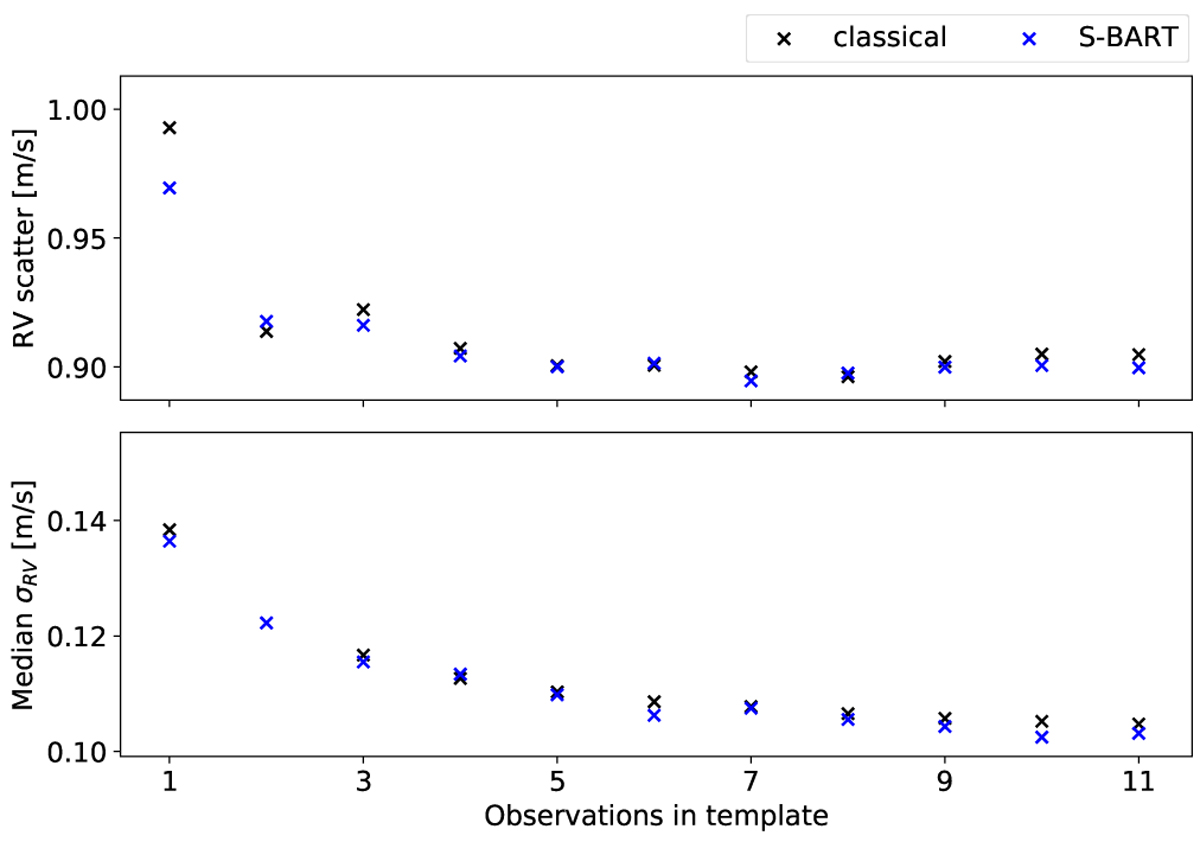
Evolution of the RV scatter (top panel) and median uncertainty (bottom panel) with respect to 13 ESPRESS018 observations of an M-type star as a function of the number of spectra used to construct the template. The results from the classical methodology and the S–BART methodology are shown in black and blue, respectively.
Current usage metrics show cumulative count of Article Views (full-text article views including HTML views, PDF and ePub downloads, according to the available data) and Abstracts Views on Vision4Press platform.
Data correspond to usage on the plateform after 2015. The current usage metrics is available 48-96 hours after online publication and is updated daily on week days.
Initial download of the metrics may take a while.