Free Access
Fig. 7.
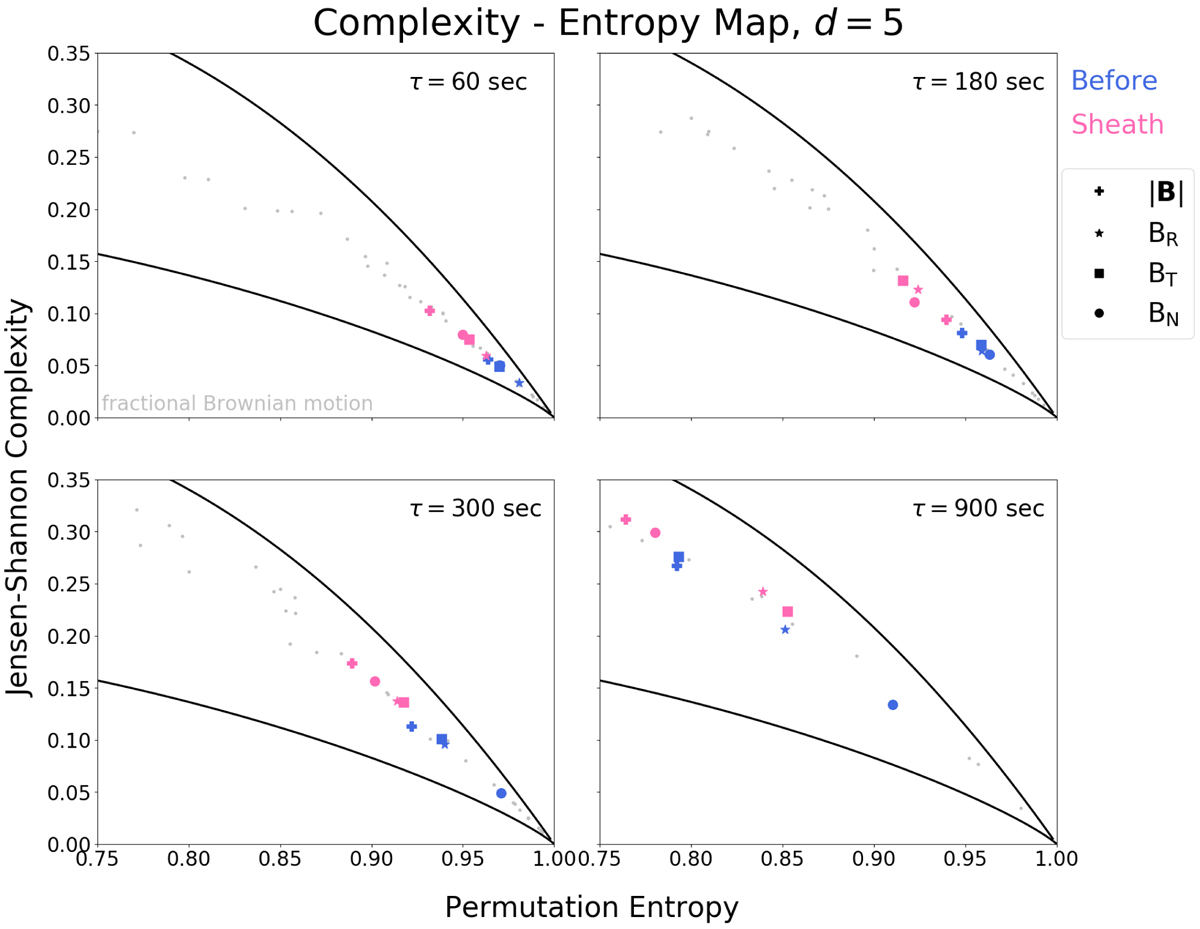
Download original image
Jensen-Shannon permutation entropy – complexity map calculated for 3-h periods in the upstream and in the sheath. The black curves show the maximum and minimum complexity curves. Grey dots show the stochastic fractional Gaussian motion.
Current usage metrics show cumulative count of Article Views (full-text article views including HTML views, PDF and ePub downloads, according to the available data) and Abstracts Views on Vision4Press platform.
Data correspond to usage on the plateform after 2015. The current usage metrics is available 48-96 hours after online publication and is updated daily on week days.
Initial download of the metrics may take a while.