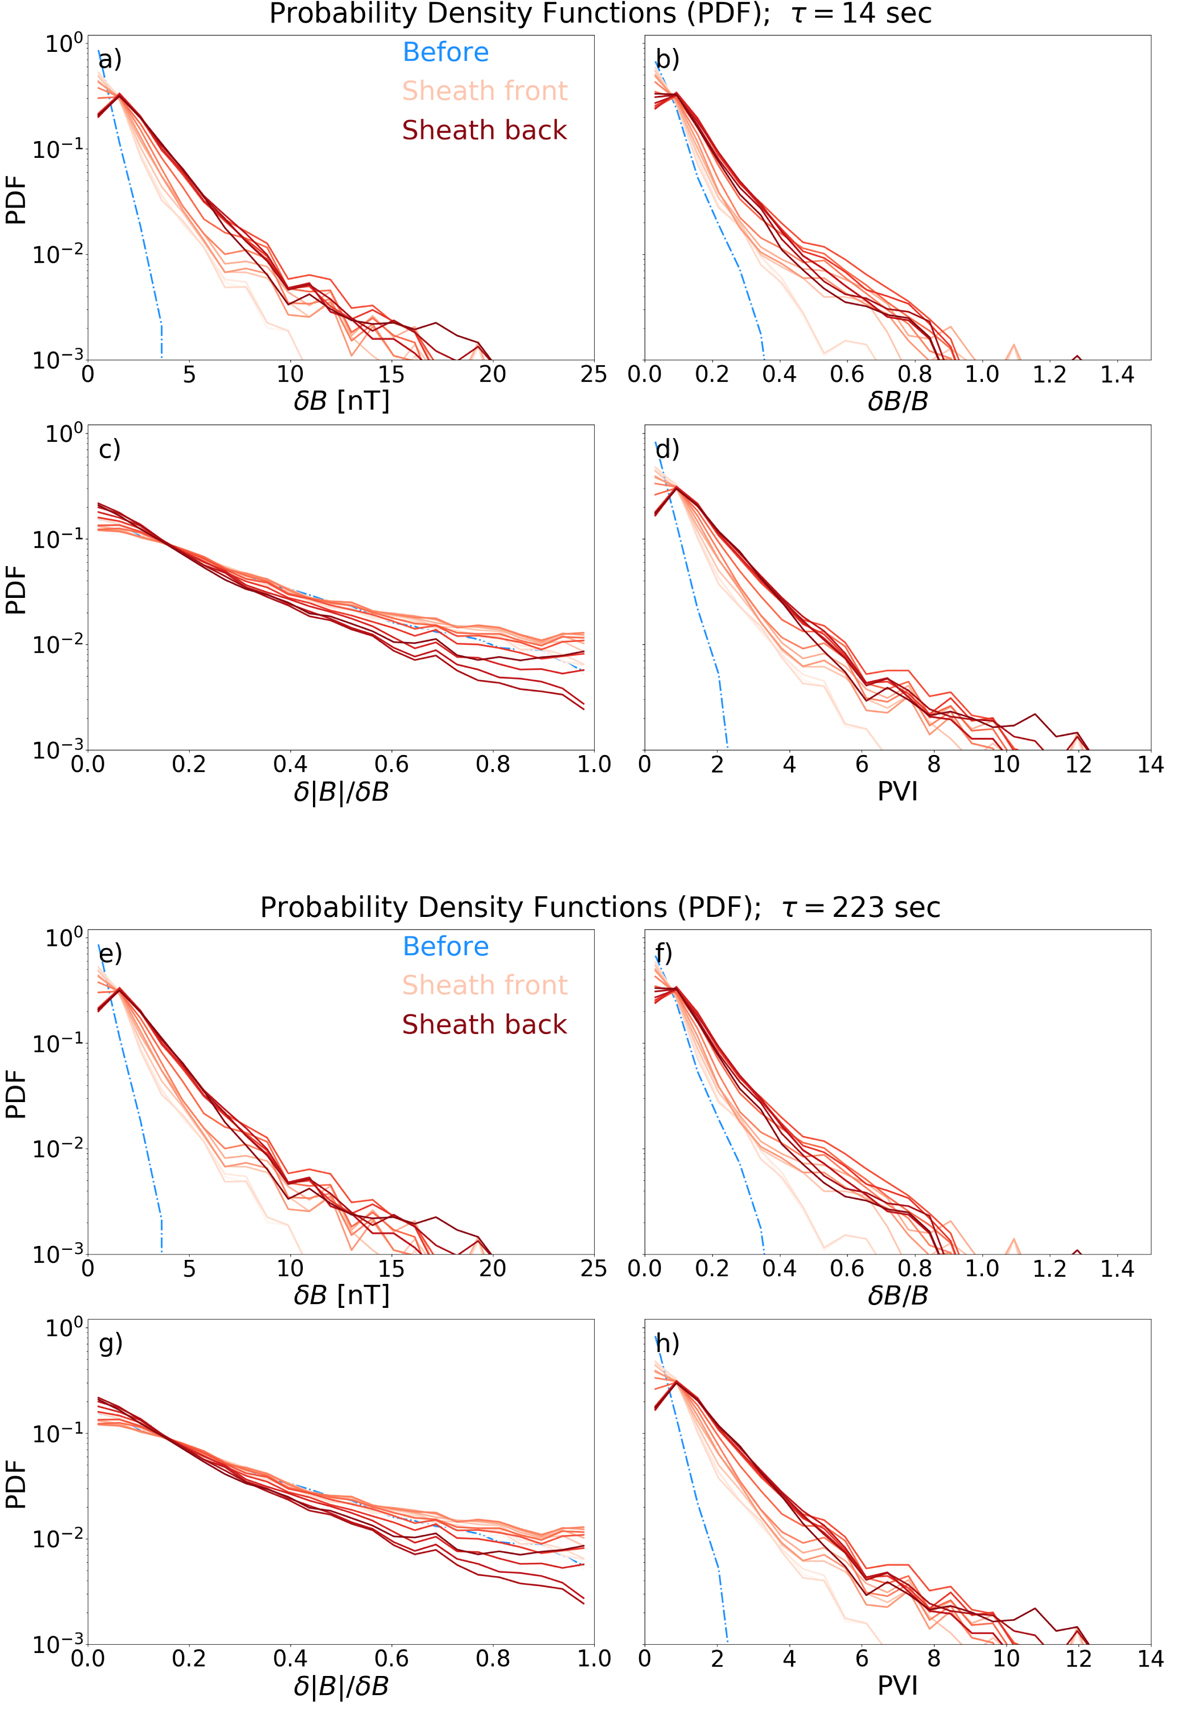
Fig. 3.
Download original image
Probability density functions in panels a and e of the fluctuation amplitude (δB), in panels b and f for the normalised fluctuation amplitude (δB/B), in panels c and g for the magnetic compressibility of fluctuations (δ|B|/δB), and in panels d and h for the PVI for the timescale (top) 14 s and (bottom) 223 s. The blue histograms show the results for the 1-h interval of the solar wind before the shock, and the light orange to dark red curves for 1-h intervals in the sheath. The shade of red darkens from the shock to the ICME leading edge.
Current usage metrics show cumulative count of Article Views (full-text article views including HTML views, PDF and ePub downloads, according to the available data) and Abstracts Views on Vision4Press platform.
Data correspond to usage on the plateform after 2015. The current usage metrics is available 48-96 hours after online publication and is updated daily on week days.
Initial download of the metrics may take a while.