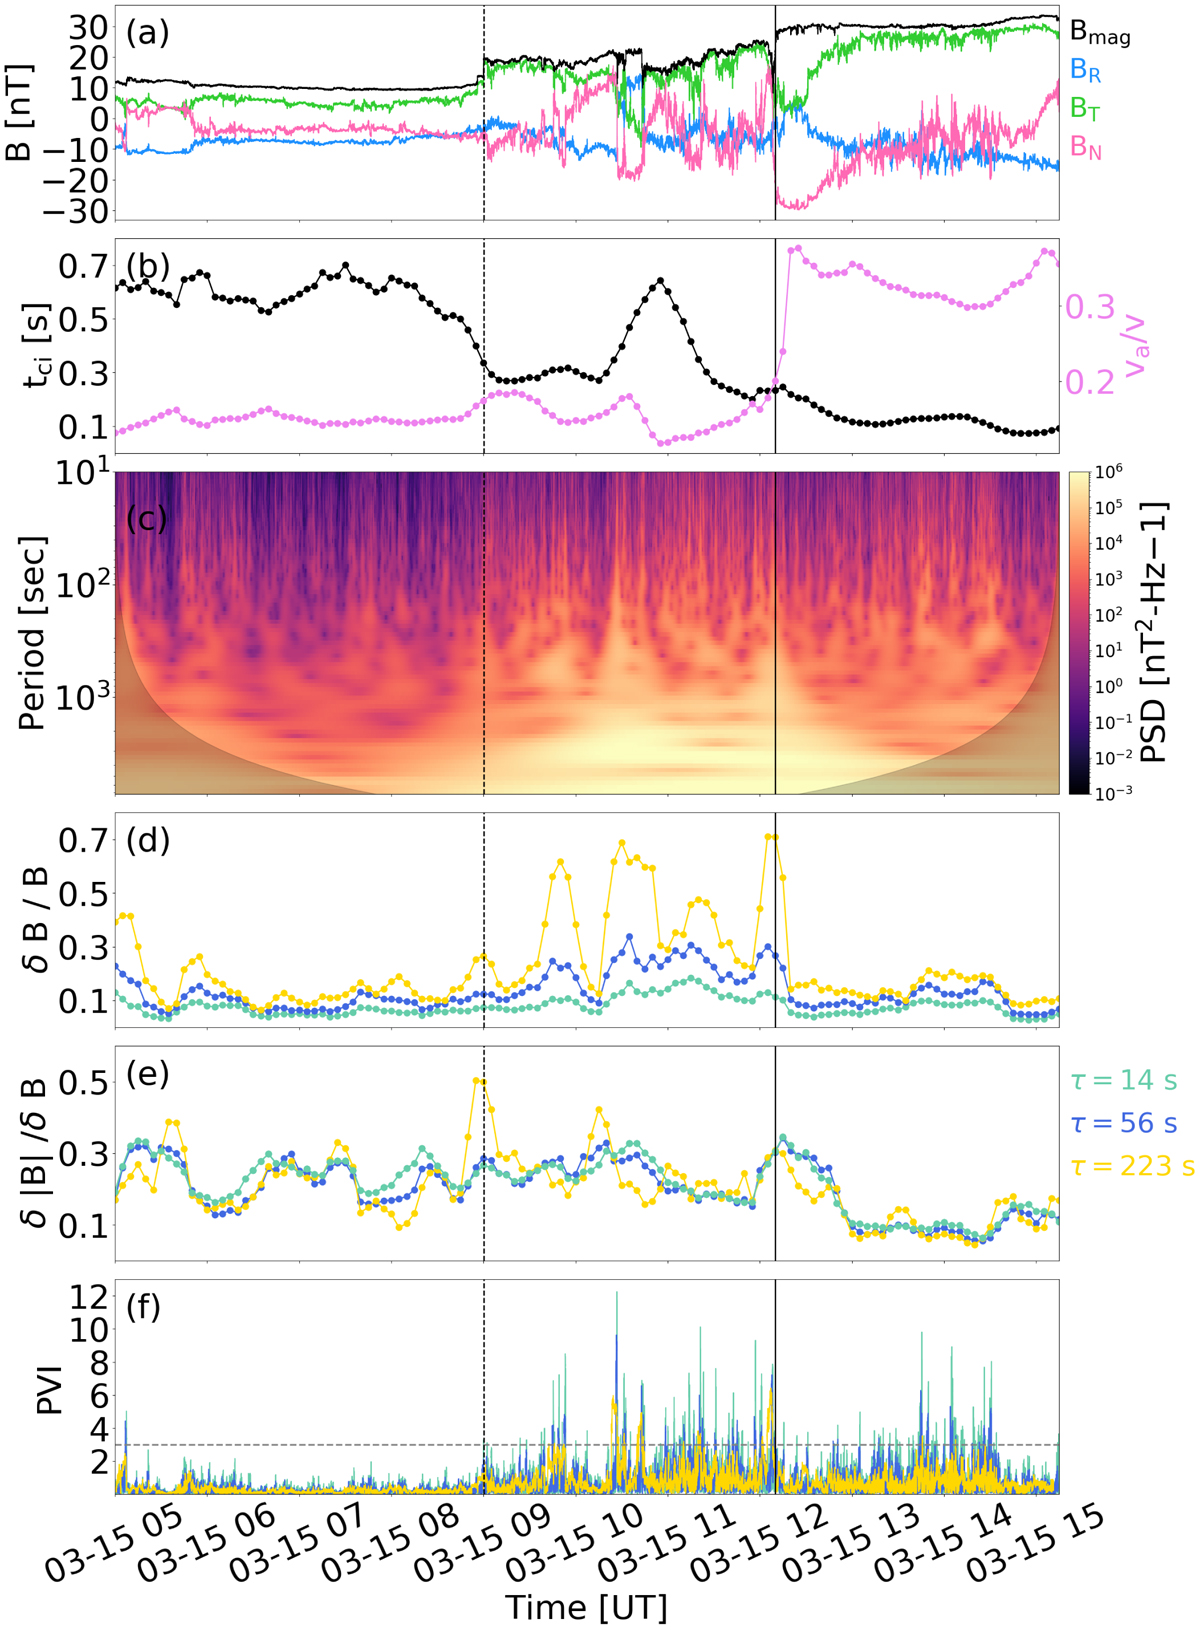
Fig. 2.
Download original image
Magnetic field fluctuations during the sheath on March 15, 2019. From top to bottom: (a) the magnetic field magnitude (black) and three magnetic field components in RTN (blue: BR, green: BT, pink: BN), (b) the ion cyclotron timescale (tci) and the ratio of the Alfvén speed to solar wind speed (vA/v), (c) the wavelet PSD of magnetic field fluctuations in the periods of 1 s to 2 h (∼0.1 mHz–1 Hz frequency range), (d) the normalised magnetic field fluctuations (δB/B), (e) the fluctuation compressibility (δ|B|/δB), and (f) the PVI. The properties at three different MHD timescales (14 s, 56 s, and 223 s) are shown in panels d–f. Panels b, d, and e: values are calculated with a 20-min window sliding in 5-min steps through the investigated interval. The horizontal line in panel f marks the value PVI = 3. The vertical dashed line marks the shock, and the solid line shows the ICME leading edge, similar to Fig. 1.
Current usage metrics show cumulative count of Article Views (full-text article views including HTML views, PDF and ePub downloads, according to the available data) and Abstracts Views on Vision4Press platform.
Data correspond to usage on the plateform after 2015. The current usage metrics is available 48-96 hours after online publication and is updated daily on week days.
Initial download of the metrics may take a while.