Fig. 1.
Download original image
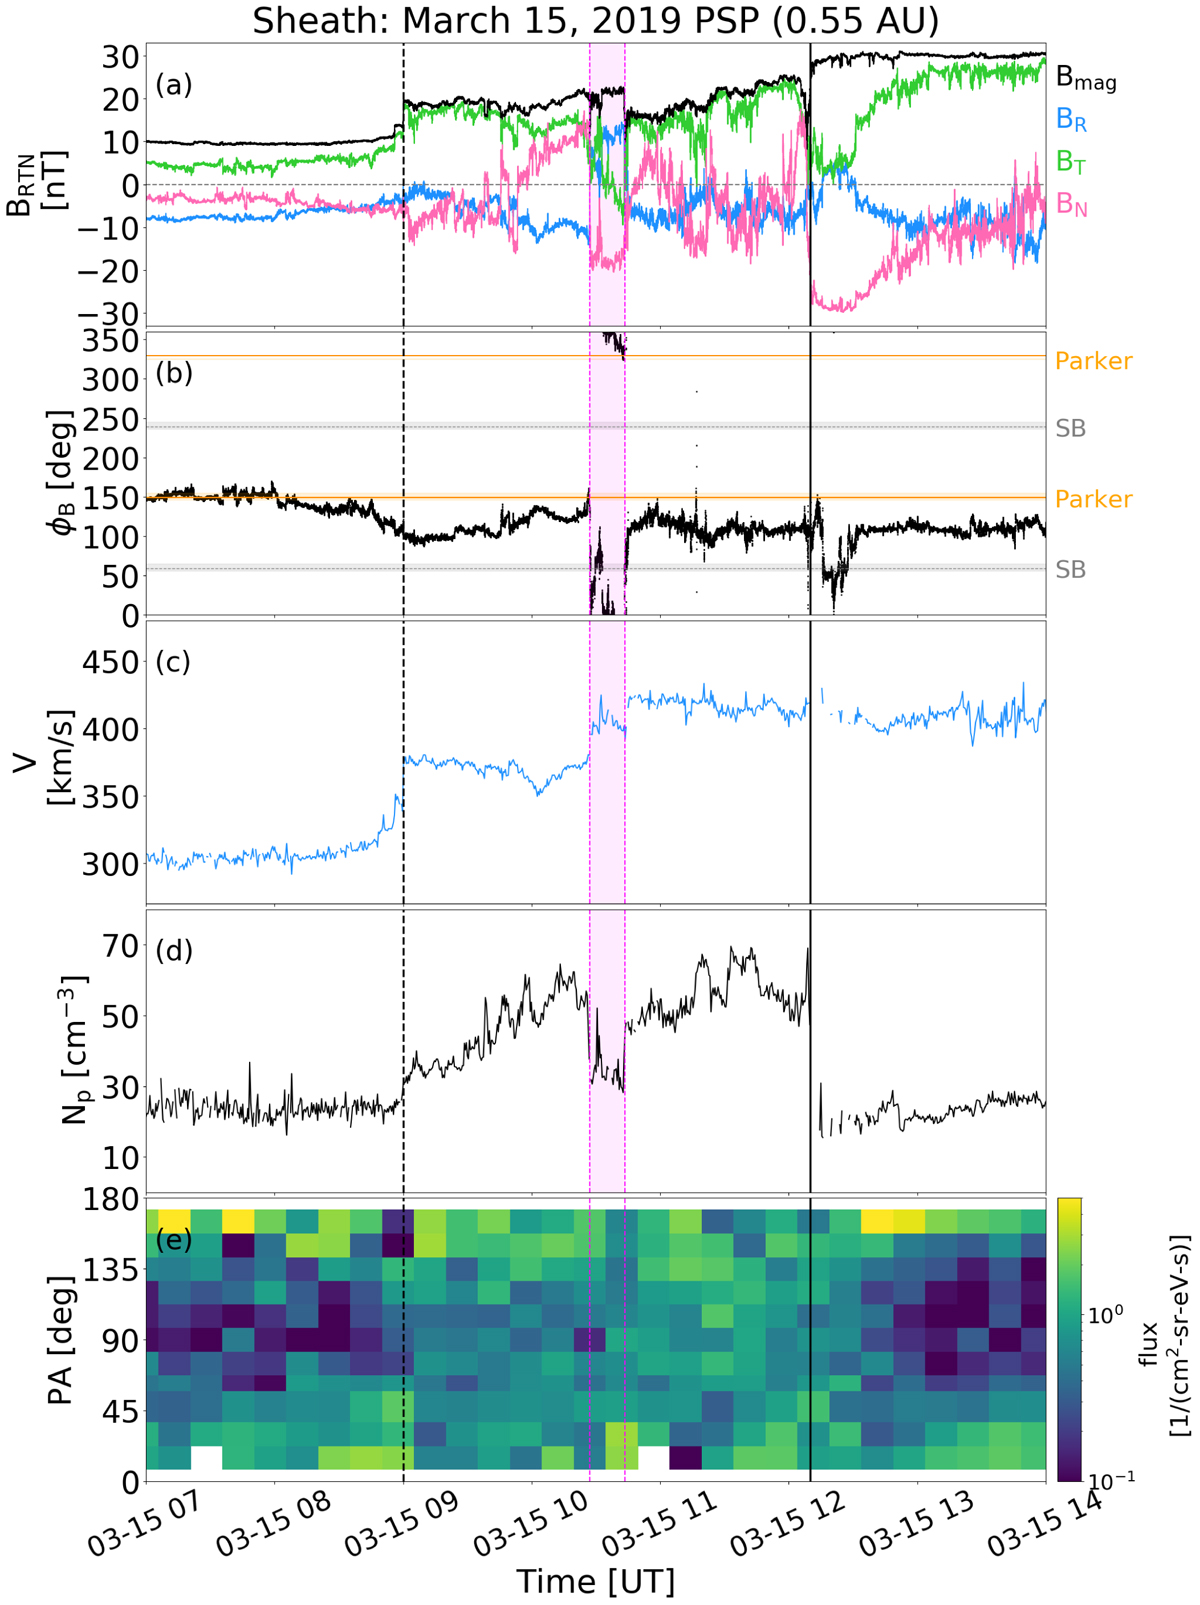
Solar wind magnetic field, plasma, and suprathermal electron data as measured by the PSP during the ICME-driven sheath region on March 15, 2019. From top to bottom: (a) magnetic field magnitude (black) and three magnetic field components in RTN (blue: BR, green: BT, pink: BN). (b) Azimuth RTN angle of the magnetic field. (c) Solar wind velocity R-component. (d) Solar wind density. (e) Normalised (to the mean of each time) suprathermal electron pitch angle distributions for the energy range 352.9−438.8 eV. The dashed vertical line shows the shock, and the solid vertical line shows the ICME leading edge. Two vertical dashed pink lines and the pink shaded area in between mark the region between the two reconnection exhausts (see text for details). The horizontal orange lines in panel 1b mark the Parker spiral directions calculated for the average solar wind speed during the investigated interval, and the shaded region indicates the range obtained using the minimum and maximum speeds. The grey horizontal lines in panel 1b show the SBs between towards and away sectors.
Current usage metrics show cumulative count of Article Views (full-text article views including HTML views, PDF and ePub downloads, according to the available data) and Abstracts Views on Vision4Press platform.
Data correspond to usage on the plateform after 2015. The current usage metrics is available 48-96 hours after online publication and is updated daily on week days.
Initial download of the metrics may take a while.