Open Access
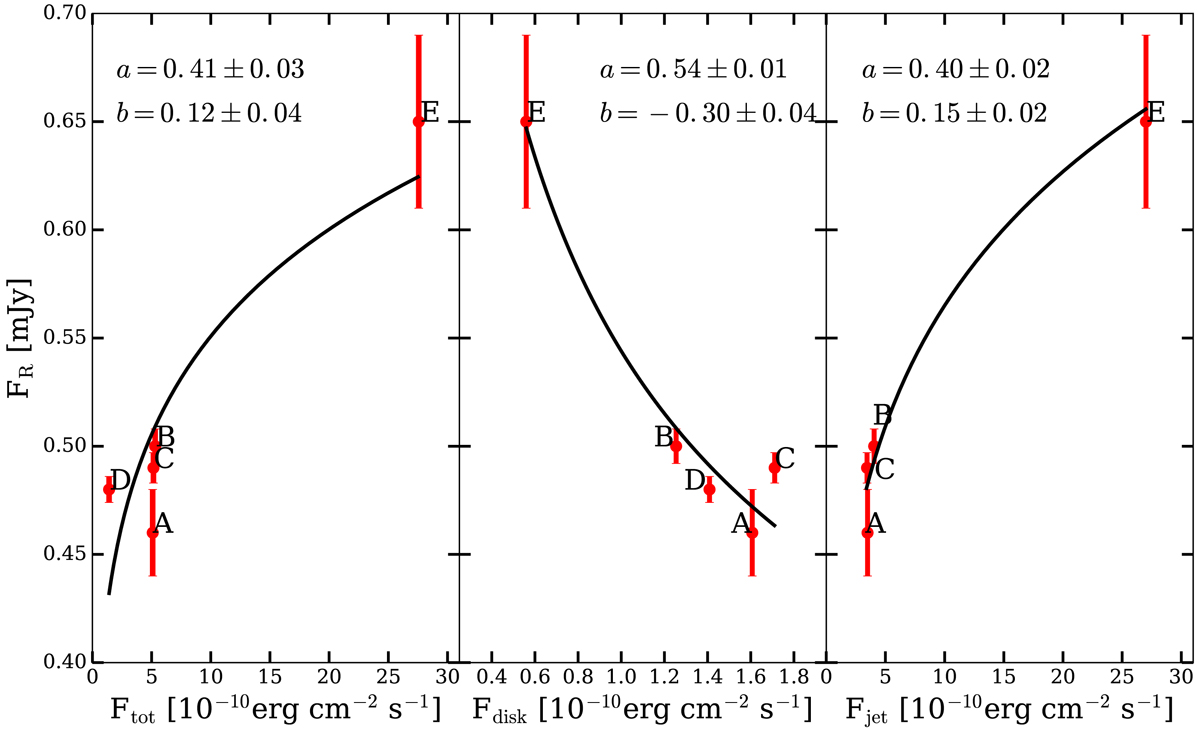
Fig. 8.
Download original image
Radio flux variation with different components of the flux obtained from TCAF model fit. The red solid circles are the observed data points and the black solid line is the functional dependence between fluxes.
Current usage metrics show cumulative count of Article Views (full-text article views including HTML views, PDF and ePub downloads, according to the available data) and Abstracts Views on Vision4Press platform.
Data correspond to usage on the plateform after 2015. The current usage metrics is available 48-96 hours after online publication and is updated daily on week days.
Initial download of the metrics may take a while.