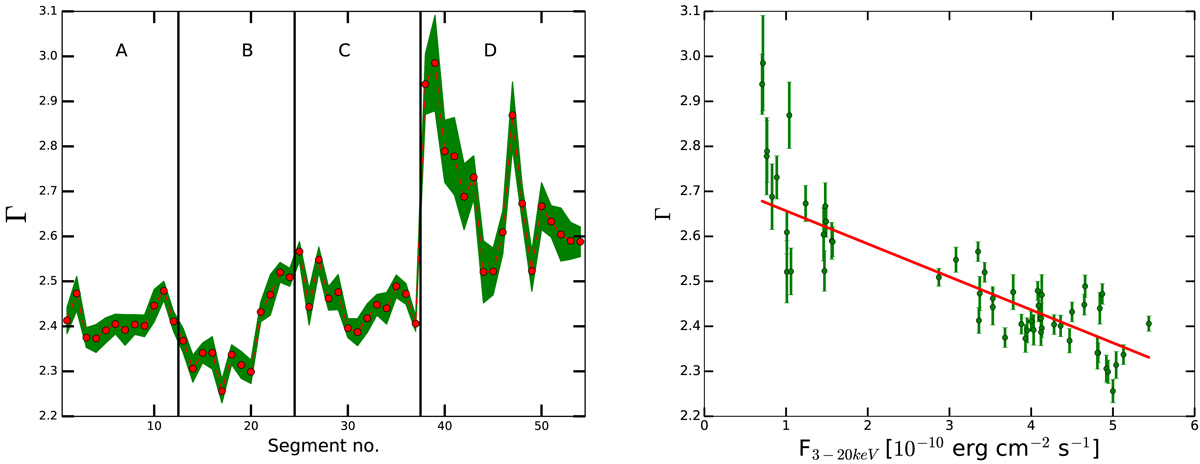
Fig. 5.
Download original image
Variation in ΓPL with segment number (left panel). The green shaded band is the 1-σ error region and the black lines show the transition from one observation to the other. The right panel shows the ΓPL variation with total flux. The red solid line is the weighted linear least-squares fit to the data. Both panels show a significant change in ΓPL from 2.2 to 3.0 in about 83 days.
Current usage metrics show cumulative count of Article Views (full-text article views including HTML views, PDF and ePub downloads, according to the available data) and Abstracts Views on Vision4Press platform.
Data correspond to usage on the plateform after 2015. The current usage metrics is available 48-96 hours after online publication and is updated daily on week days.
Initial download of the metrics may take a while.