Fig. 3.
Download original image
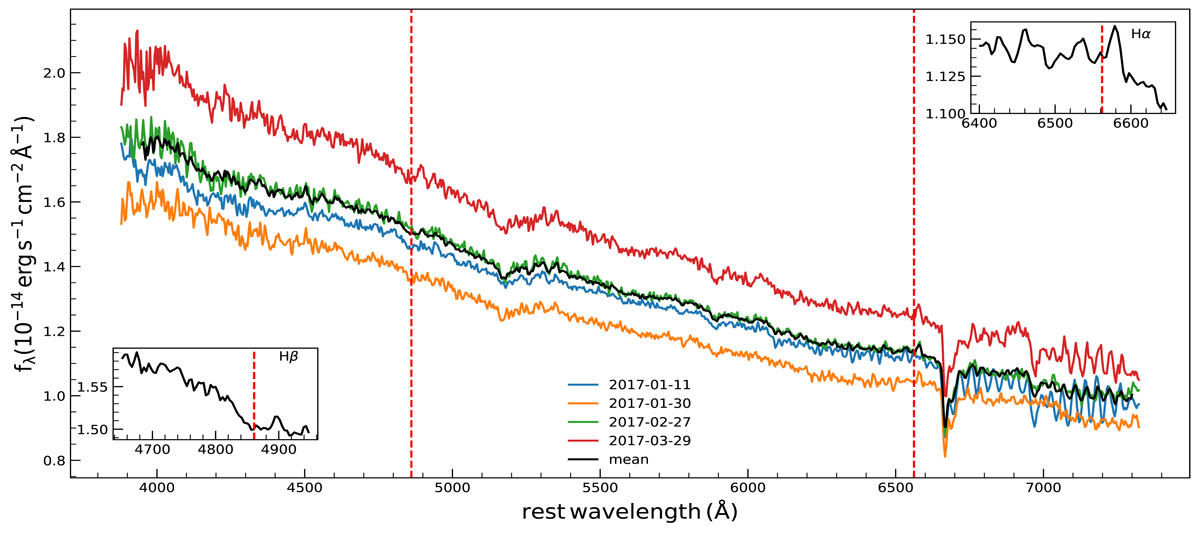
Optical spectra taken from Steward Observatory during the same observation period as considered in the NuSTAR analysis. The four different colours correspond to the four epochs considered for X-ray analysis and the black curve shows the combined spectrum. Zoomed-in regions around Hα and Hβ lines are also shown in the top right and bottom left.
Current usage metrics show cumulative count of Article Views (full-text article views including HTML views, PDF and ePub downloads, according to the available data) and Abstracts Views on Vision4Press platform.
Data correspond to usage on the plateform after 2015. The current usage metrics is available 48-96 hours after online publication and is updated daily on week days.
Initial download of the metrics may take a while.