Fig. 1.
Download original image
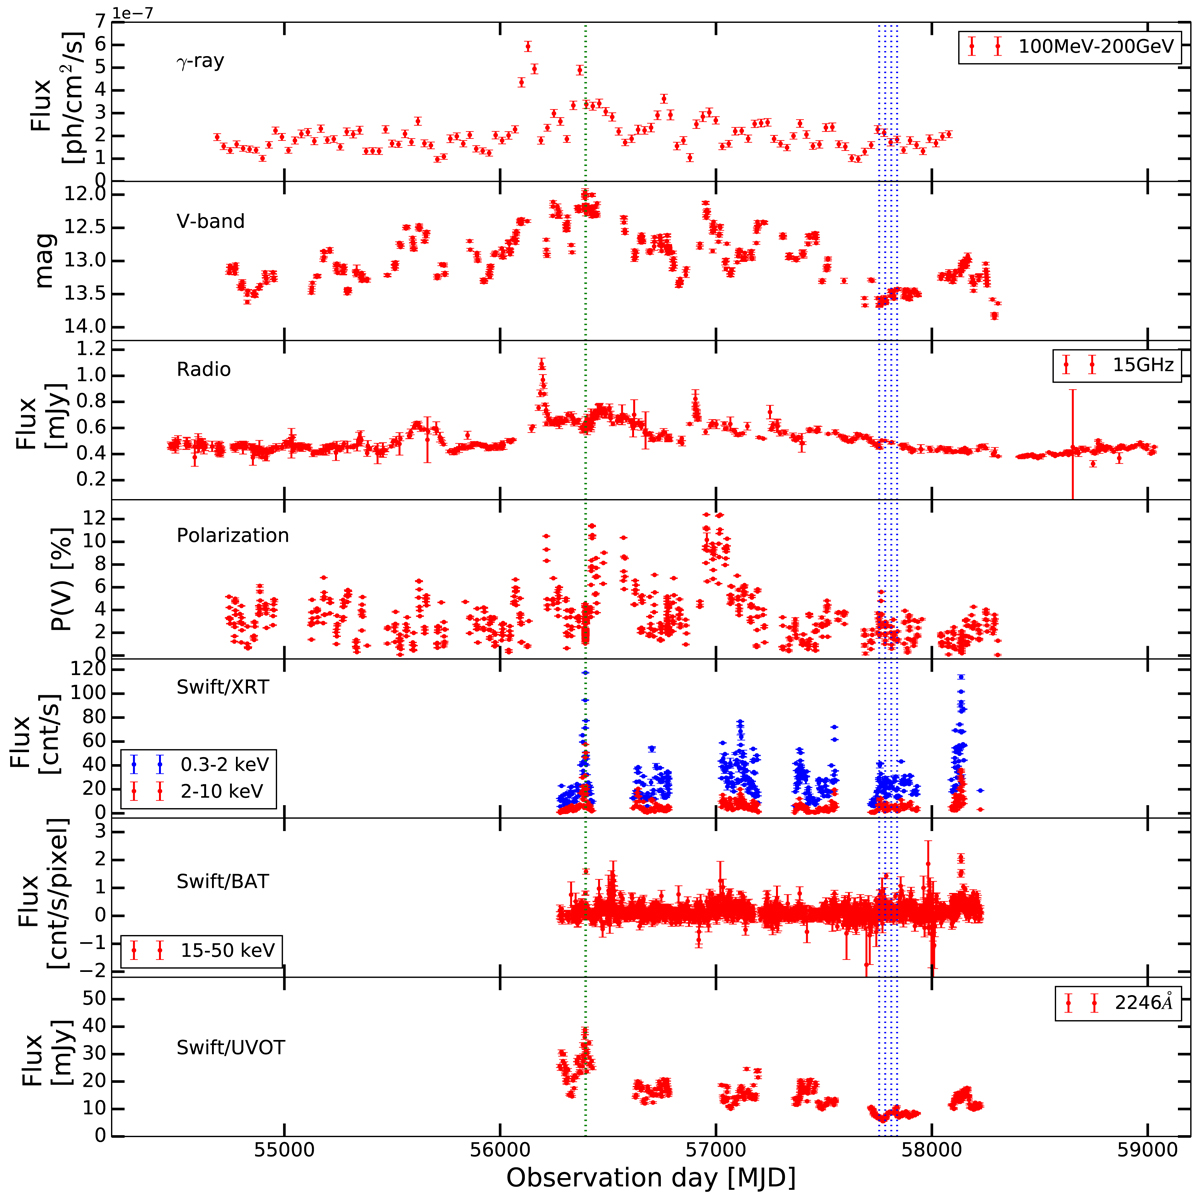
Long-term flux and polarisation variation of the source. From top, we show the flux variation in the γ-ray, optical and radio bands. The bottom panel shows the variation in the degree of polarisation (%) in the optical V-band. The blue dashed lines show the epochs of NuSTAR observations studied here. The green dotted line correspond to data taken during April 2013. The bottom three panels show the fluxes from the Swift observation. The X-ray and UV light curves are taken from Arbet-Engels et al. (2021).
Current usage metrics show cumulative count of Article Views (full-text article views including HTML views, PDF and ePub downloads, according to the available data) and Abstracts Views on Vision4Press platform.
Data correspond to usage on the plateform after 2015. The current usage metrics is available 48-96 hours after online publication and is updated daily on week days.
Initial download of the metrics may take a while.