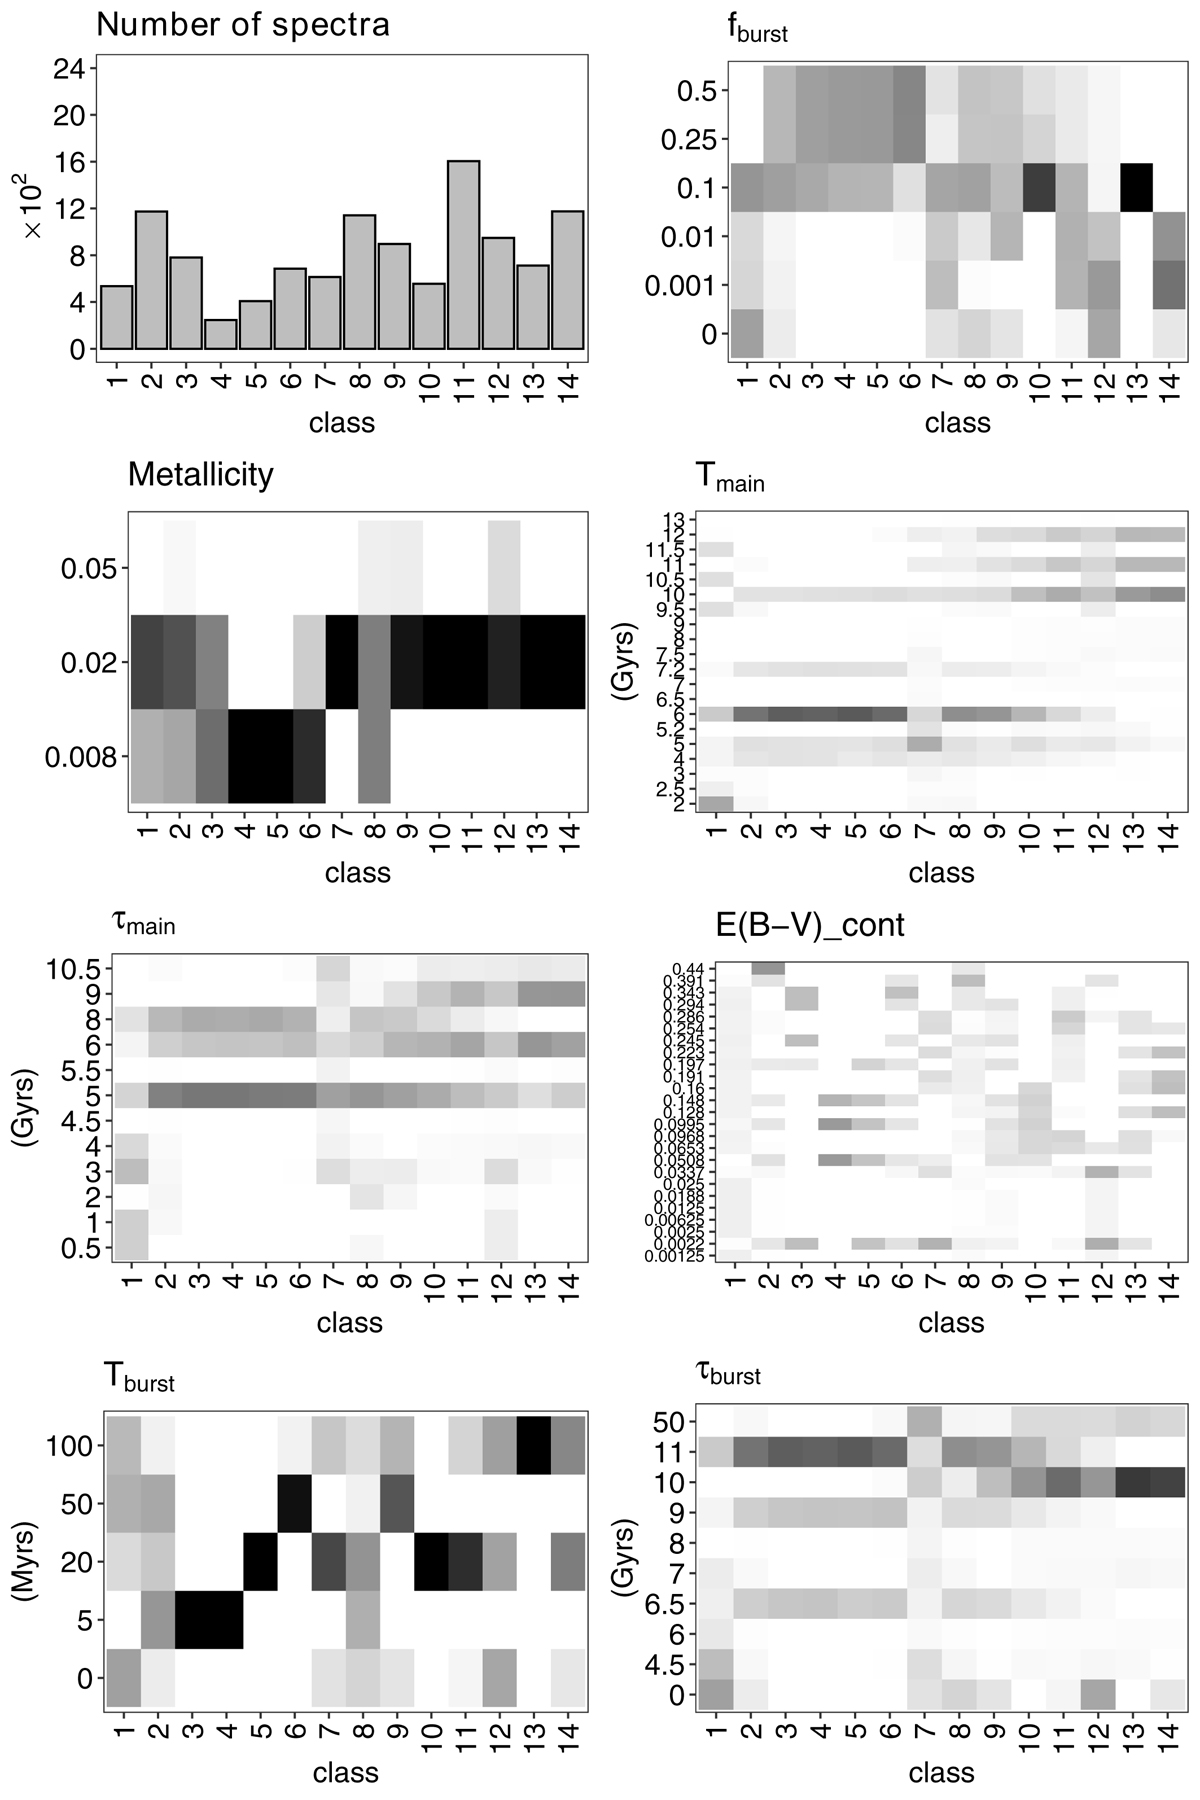
Fig. 6.
Download original image
Fourteen-cluster classification of the noiseless spectra. Top left: number of spectra contained in each class. All others: heatmaps of the relevant CIGALE input parameters among the 14 classes on noiseless spectra. All possible parameter values (see Table A.1) are represented on the y-axis, and the class index on the x-axis. The within-class densities of the parameter values are illustrated in the form of a heatmap, where a dark square equates to a density of 1, and white of 0. The classes are sorted by ascending average Tmain.
Current usage metrics show cumulative count of Article Views (full-text article views including HTML views, PDF and ePub downloads, according to the available data) and Abstracts Views on Vision4Press platform.
Data correspond to usage on the plateform after 2015. The current usage metrics is available 48-96 hours after online publication and is updated daily on week days.
Initial download of the metrics may take a while.