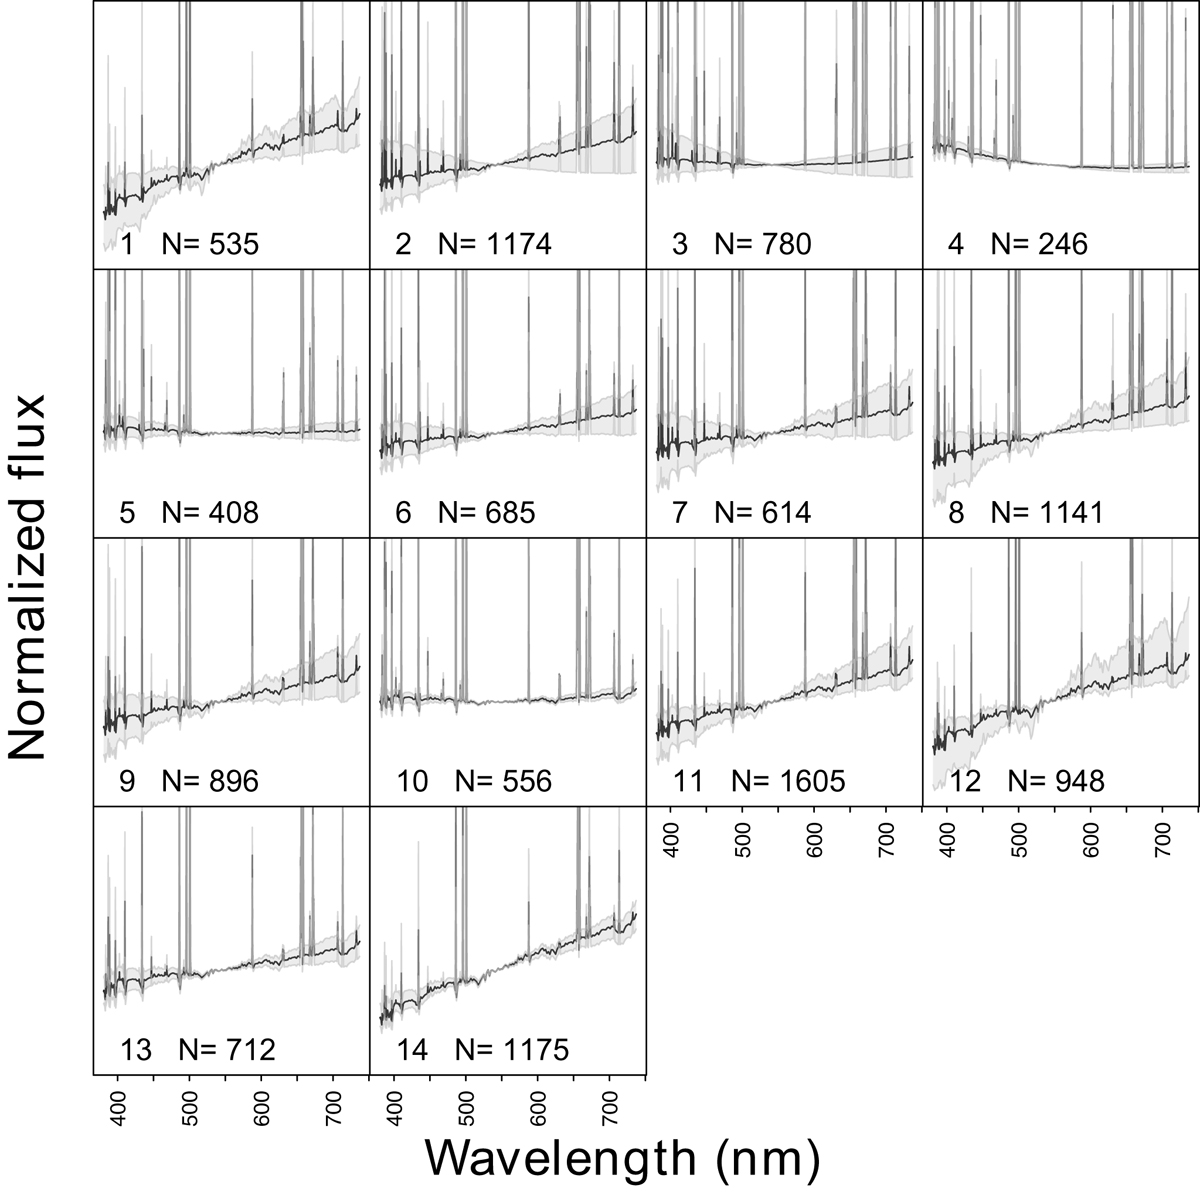
Fig. 4.
Download original image
Fourteen-cluster classification of the noiseless spectra, with the mean spectra (in black) and their dispersion (in grey) for every class. N is the number of members in each class. All the spectra were normalised by their mean values between 505 and 581 nm, a region where the spectra have no emission lines. The scale is the same for all panels and all other figures of spectra throughout this paper. The dispersion corresponds to the 10% and 90% quantiles for each monochromatic flux. The classes are sorted by ascending average Tmain.
Current usage metrics show cumulative count of Article Views (full-text article views including HTML views, PDF and ePub downloads, according to the available data) and Abstracts Views on Vision4Press platform.
Data correspond to usage on the plateform after 2015. The current usage metrics is available 48-96 hours after online publication and is updated daily on week days.
Initial download of the metrics may take a while.