Open Access
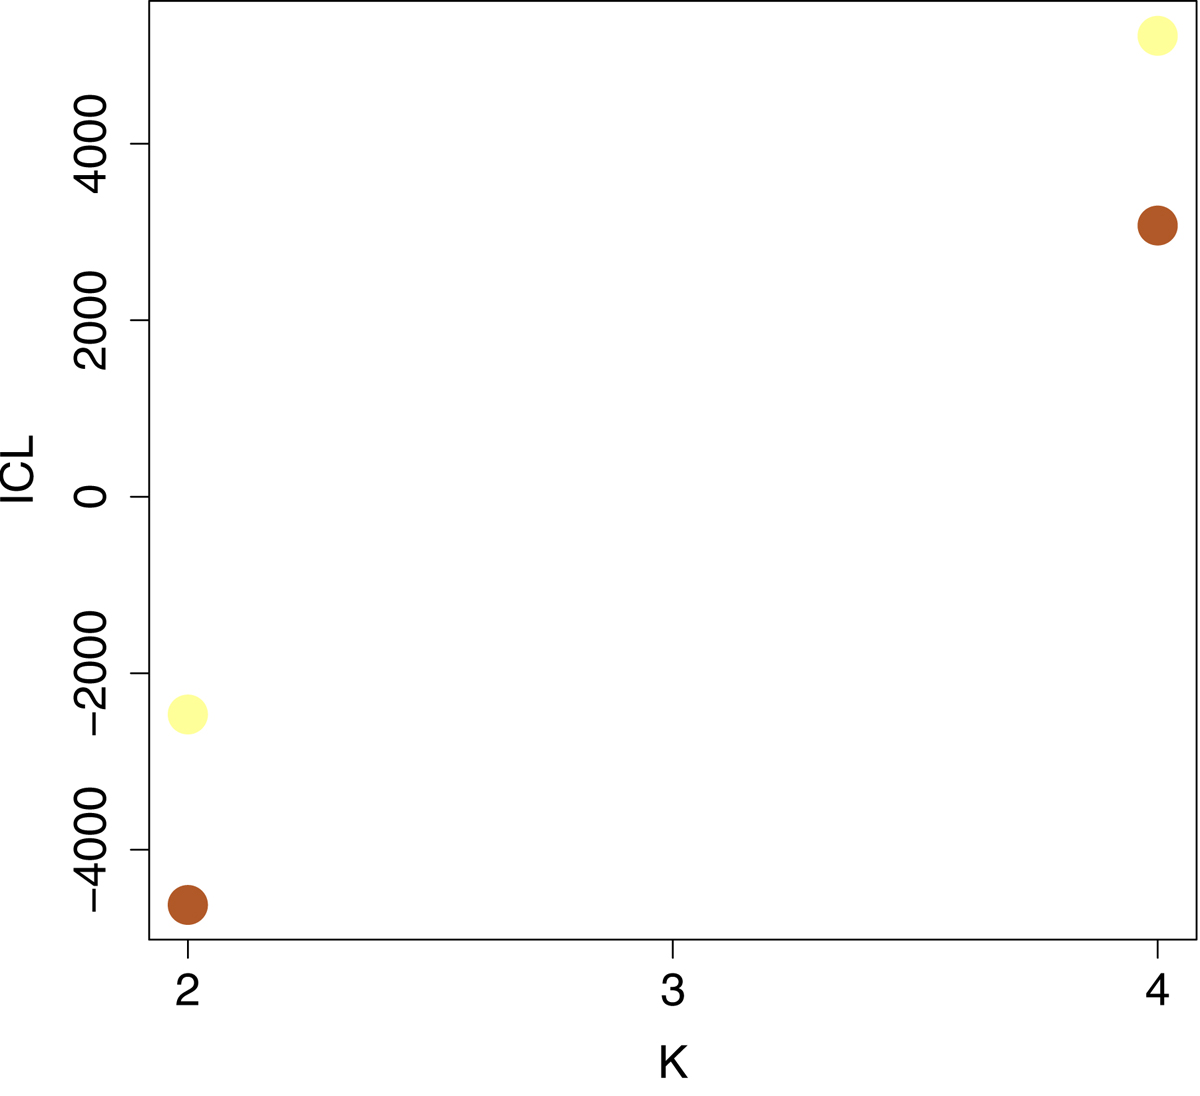
Fig. C.1.
Download original image
All the ICL values as a function of the number of cluster K obtained for the toy model. Each point corresponds to a successful run of Fisher-EM for one of the 12 statistical models. This figure should be compared with Fig. 2.
Current usage metrics show cumulative count of Article Views (full-text article views including HTML views, PDF and ePub downloads, according to the available data) and Abstracts Views on Vision4Press platform.
Data correspond to usage on the plateform after 2015. The current usage metrics is available 48-96 hours after online publication and is updated daily on week days.
Initial download of the metrics may take a while.