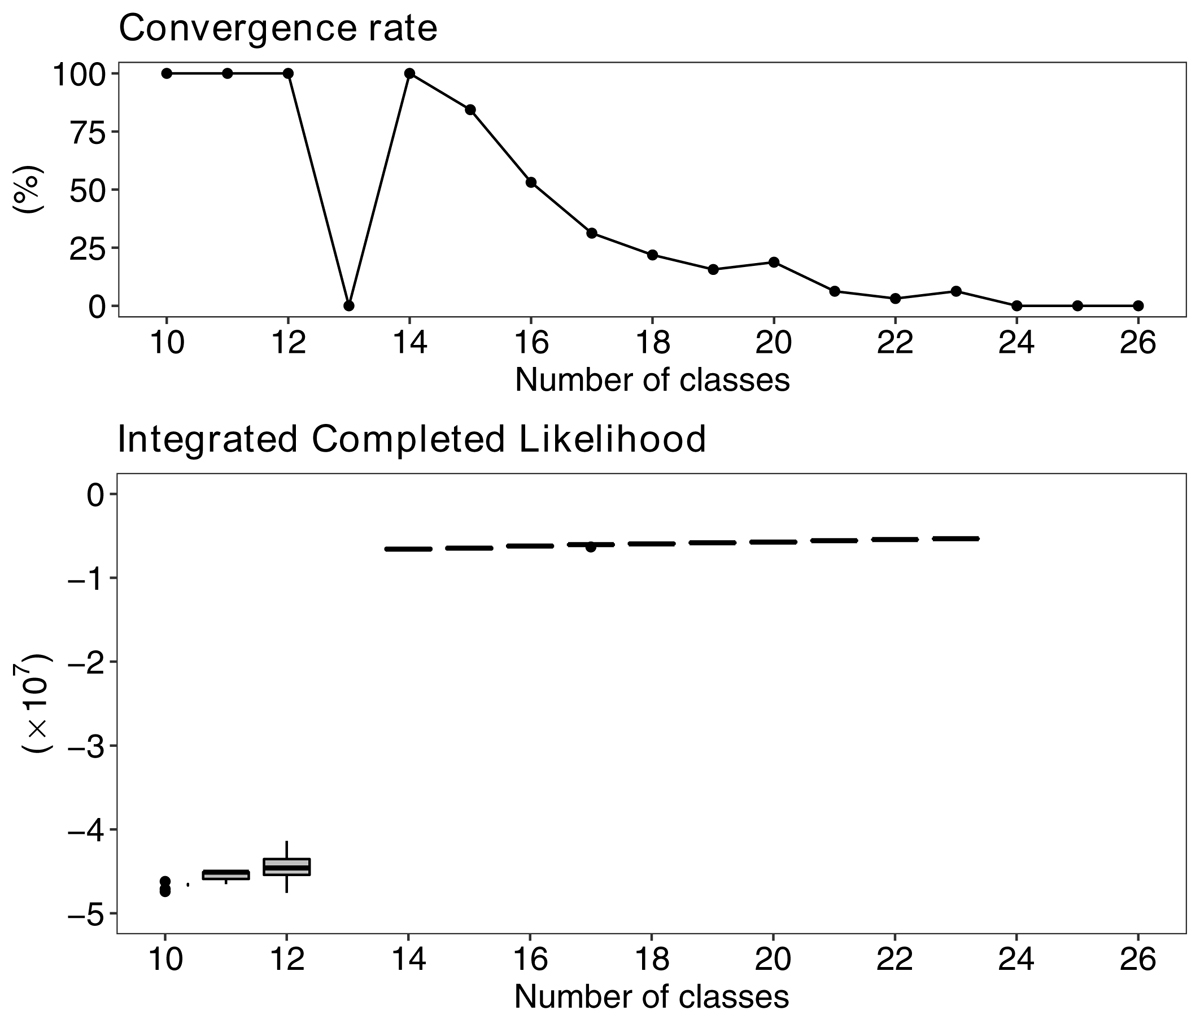
Fig. 2.
Download original image
Clustering analysis of noiseless spectra with Fisher-EM. Top: convergence rate as a function of K. For every K value considered, 32 classifications were calculated. Bottom: boxplots of the ICL are a function of the number of clusters K. The horizontal bars show the median value, the boxes represent the two quartile values, the whiskers extend to points that lie within 1.5 times the interquartile range of the lower and upper quartile, and data beyond are shown individually with dots.
Current usage metrics show cumulative count of Article Views (full-text article views including HTML views, PDF and ePub downloads, according to the available data) and Abstracts Views on Vision4Press platform.
Data correspond to usage on the plateform after 2015. The current usage metrics is available 48-96 hours after online publication and is updated daily on week days.
Initial download of the metrics may take a while.