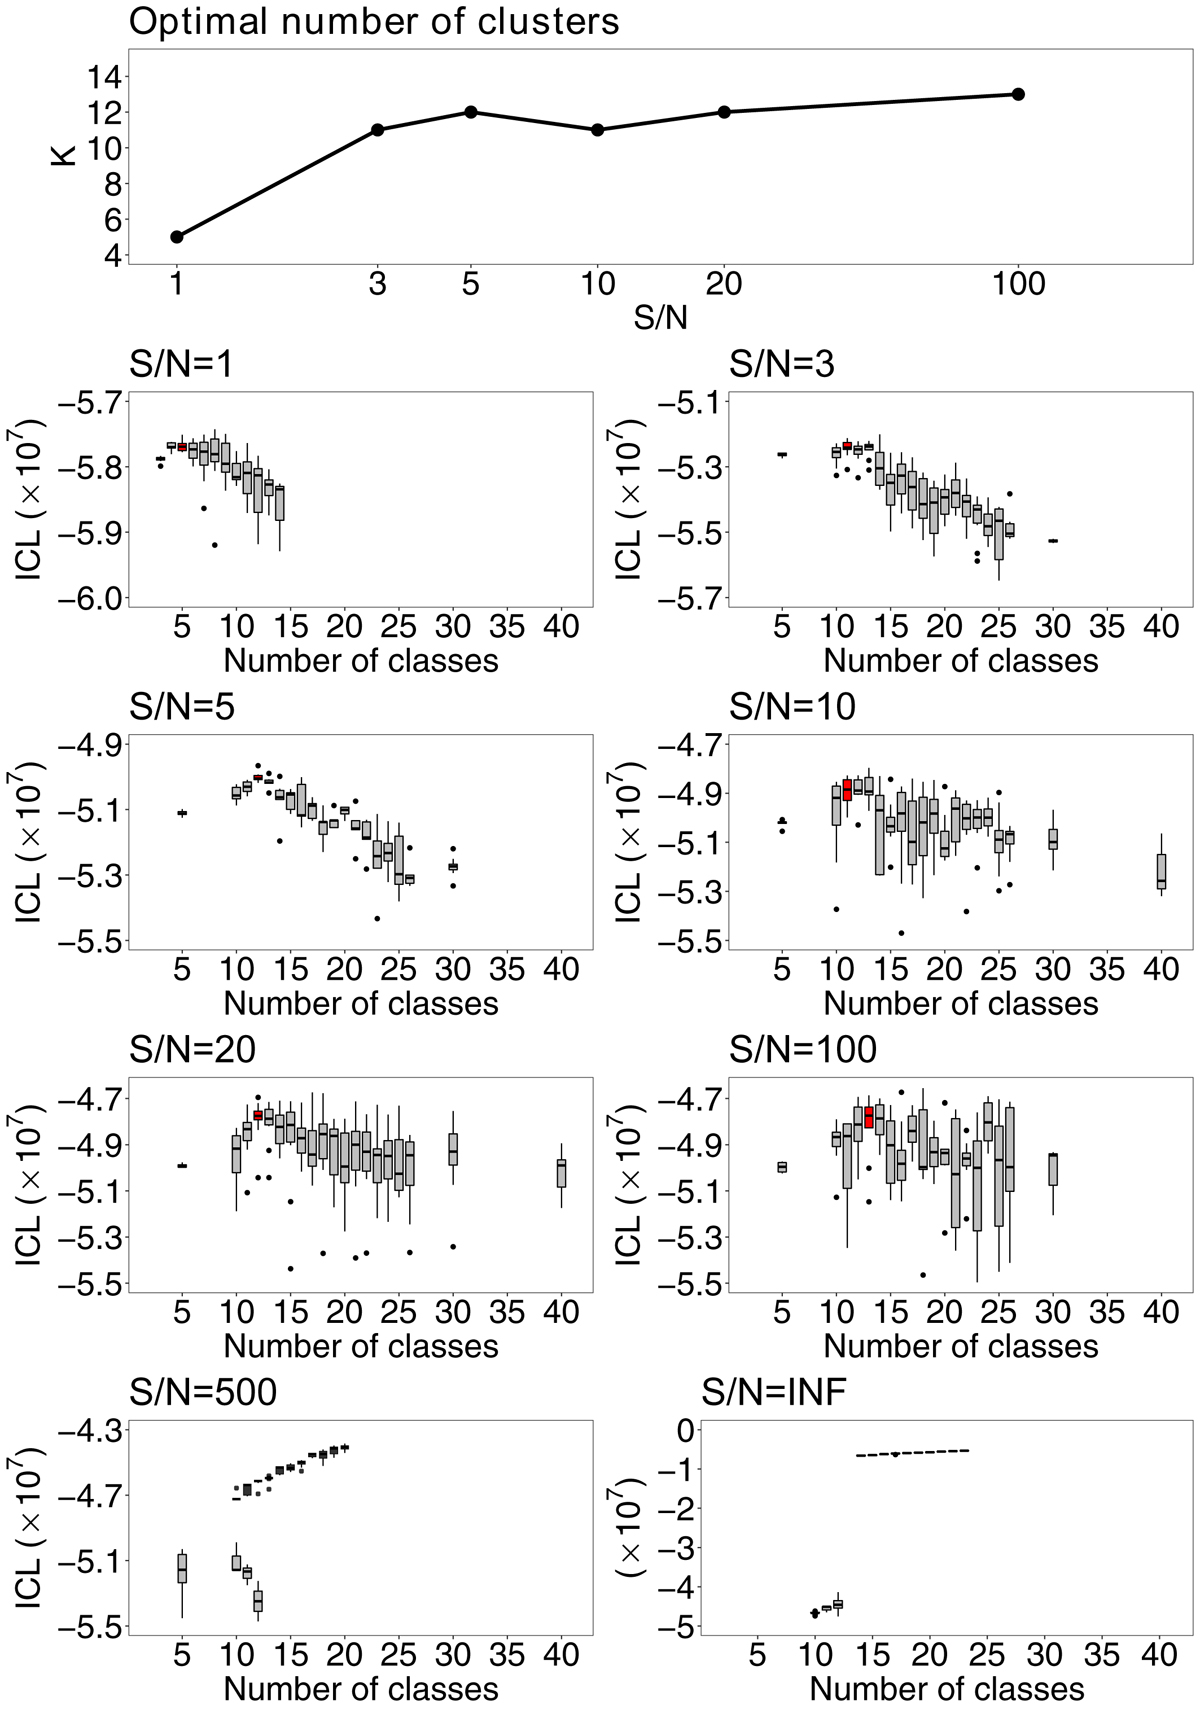
Fig. 10.
Download original image
Summary of ICLs and optimal number of clusters as a function of S/N. Top: optimal number of clusters across the different noise levels. All others: ICL as a function of K for different noise levels. In each of the panels, the red boxplot highlights the maximum median value of the ICL i.e. the associated best-fit K value. For the S/N of 500, two behaviours were observed depending on the randomly generated noise. They are both illustrated by the two sets of boxplots (black and grey) in the corresponding panel.
Current usage metrics show cumulative count of Article Views (full-text article views including HTML views, PDF and ePub downloads, according to the available data) and Abstracts Views on Vision4Press platform.
Data correspond to usage on the plateform after 2015. The current usage metrics is available 48-96 hours after online publication and is updated daily on week days.
Initial download of the metrics may take a while.