Free Access
Fig. 5
Download original image
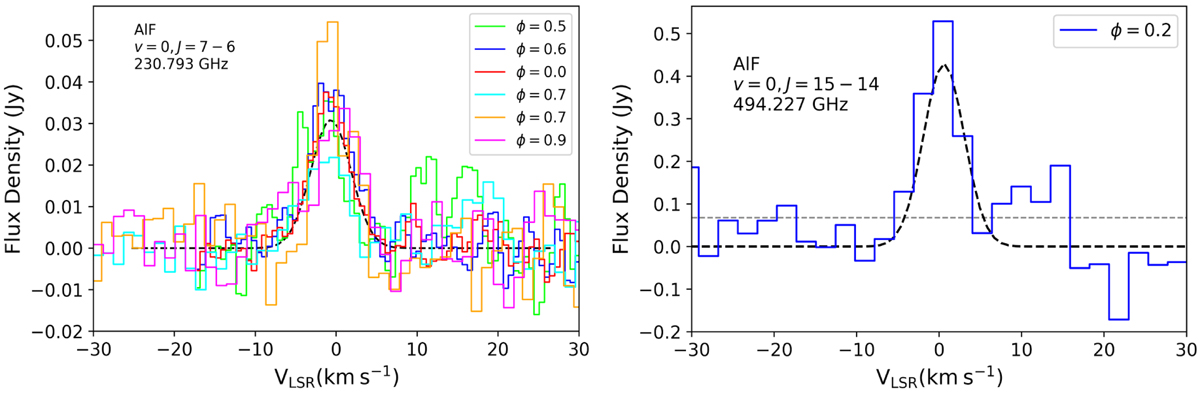
ALMA observations of AlF line emission towards R Leo (solid lines) and the results of an LTE model (dashed black lines). Stellar variability phases (ϕ) are indicated in the upper-right, and the line transitions are indicated in the upper-left panels. The grey dashed lines show the rms level.
Current usage metrics show cumulative count of Article Views (full-text article views including HTML views, PDF and ePub downloads, according to the available data) and Abstracts Views on Vision4Press platform.
Data correspond to usage on the plateform after 2015. The current usage metrics is available 48-96 hours after online publication and is updated daily on week days.
Initial download of the metrics may take a while.