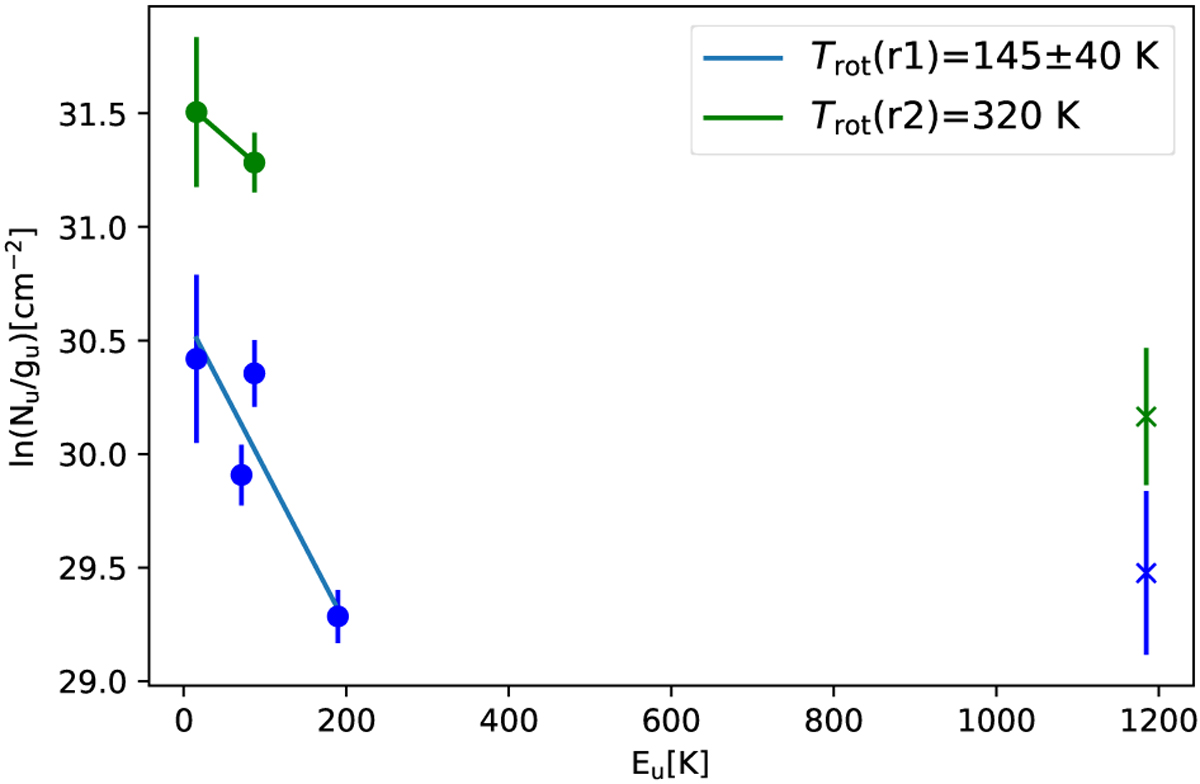
Fig. 2
Download original image
Population diagram of observed AlF rotational transitions towards o Ceti that are listed in Table 2. Blue points correspond to flux densities that are extracted from region 1 and green points correspond to those from region 2 (see Sect. 3.1 for explanations). The vibrationally excited v = 1 lines in both regions are also shown by x symbols, but they were not considered in the calculations of the rotational temperatures. The vertical error bars are calculated from the uncertainties of the integrated fluxes (uncertainty from the Gaussian fitting plus 10% of the total flux from the calibration of the data) and are considered in the fitting process.
Current usage metrics show cumulative count of Article Views (full-text article views including HTML views, PDF and ePub downloads, according to the available data) and Abstracts Views on Vision4Press platform.
Data correspond to usage on the plateform after 2015. The current usage metrics is available 48-96 hours after online publication and is updated daily on week days.
Initial download of the metrics may take a while.