Fig. 1
Download original image
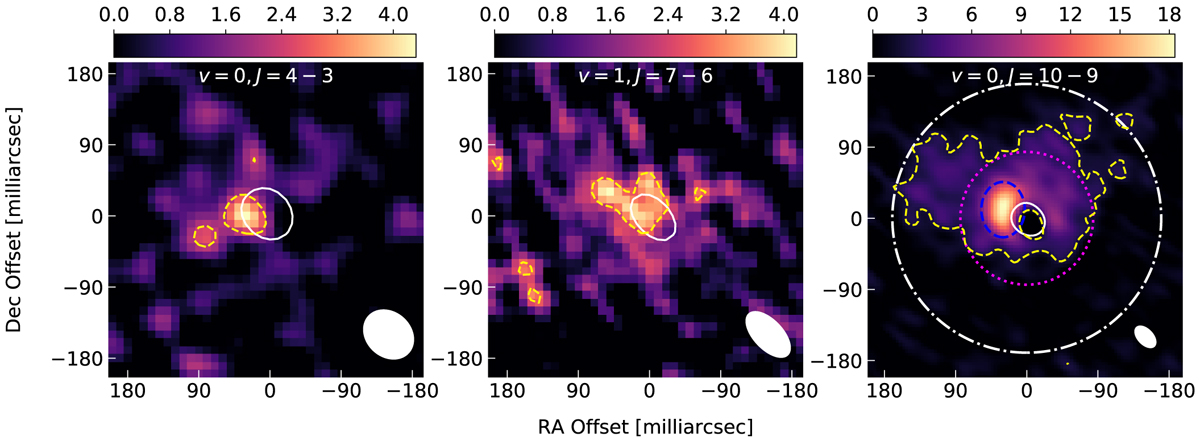
Integrated emission of the spatially resolved lines of AlF towards o Ceti. The lines are integrated in the 131.873–131.883 GHz (41–54 km s−1) range for the v, = 0, J = 4−3 line, 228.675−228.685 GHz (36−59 km s−1) for υ=1, J = 7−6, and 329.606−329.577 GHz (32−59 km s−1) for the υ = 0, J = 10−9 line. The scale is given in Jy km s−1 beam−1. The lines shown are indicated at the top of each panel. The white contours show the 50% stellar continuum emission level at the corresponding frequencies and the dashed yellow contours mark the 3-σ level of the line emission. The filled white ellipses indicate the beam size in each observation. In the right panel, the regions over which the lines were integrated (see text) are indicated by the dashed blue ellipse (peak AlF emission), dotted magenta circle (CO v = 1,J = 3−2 line emission region), and dotted-dashed white circle (all AlF emission lines).
Current usage metrics show cumulative count of Article Views (full-text article views including HTML views, PDF and ePub downloads, according to the available data) and Abstracts Views on Vision4Press platform.
Data correspond to usage on the plateform after 2015. The current usage metrics is available 48-96 hours after online publication and is updated daily on week days.
Initial download of the metrics may take a while.