Fig. 13
Download original image
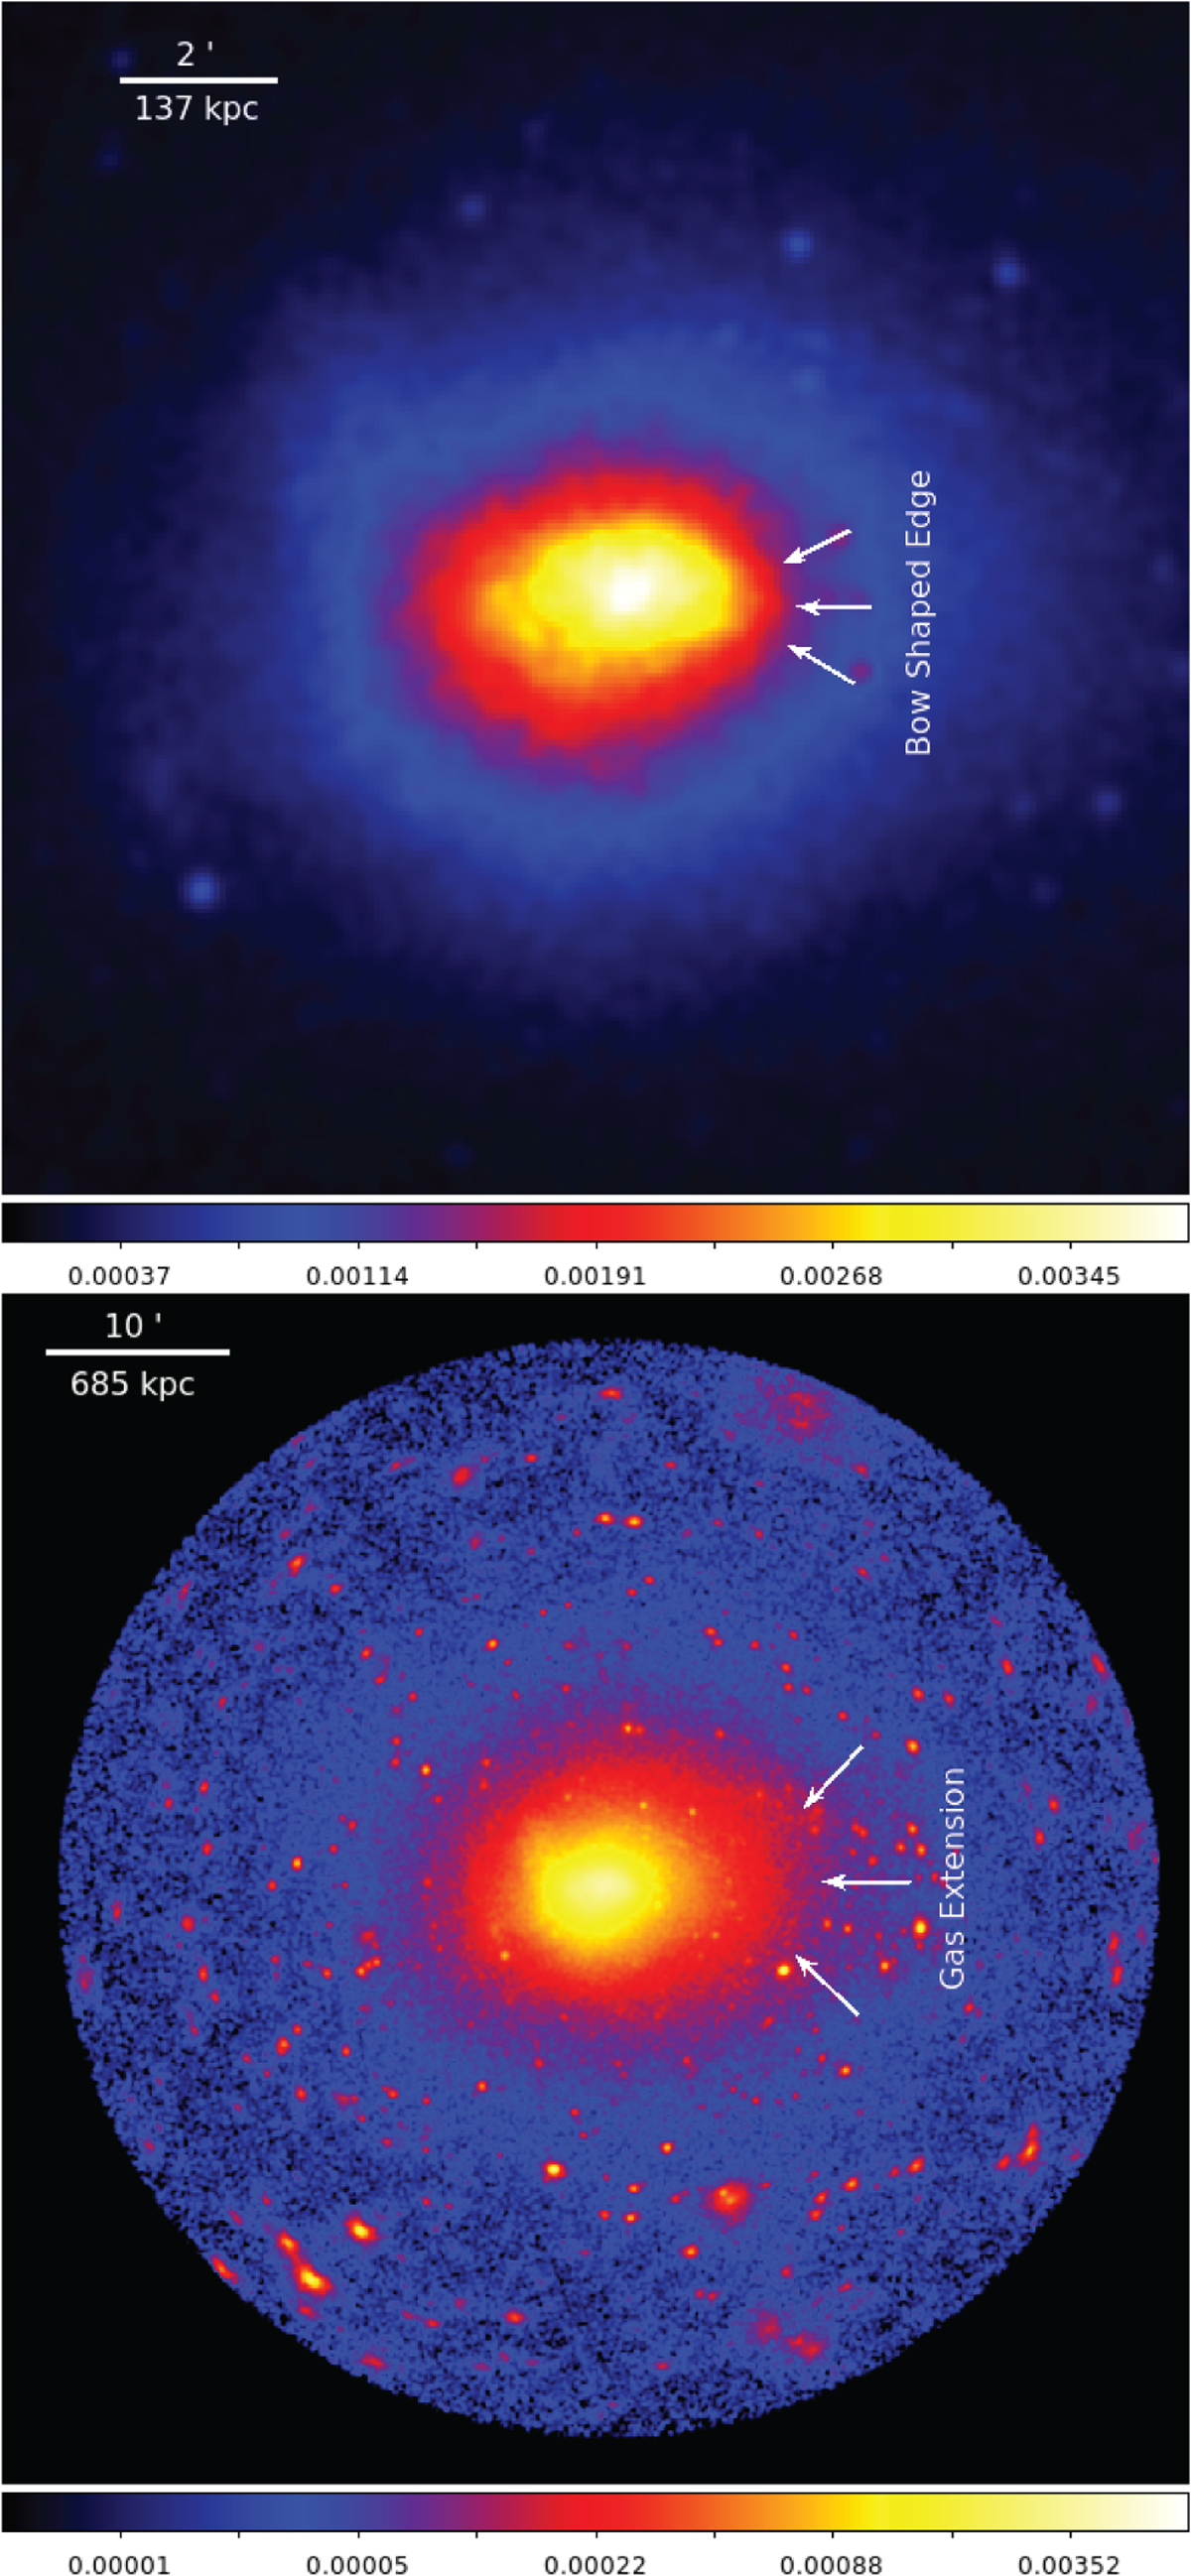
PIB-subtracted count-rate images. Top: image on a linear scale, zoomed in to the central region to show the bow-shaped edge. Bottom: image on a logarithmic scale. The arrows show the large extension of gas west of the cluster. Both images are smoothed.
Current usage metrics show cumulative count of Article Views (full-text article views including HTML views, PDF and ePub downloads, according to the available data) and Abstracts Views on Vision4Press platform.
Data correspond to usage on the plateform after 2015. The current usage metrics is available 48-96 hours after online publication and is updated daily on week days.
Initial download of the metrics may take a while.