Fig. 5.
Download original image
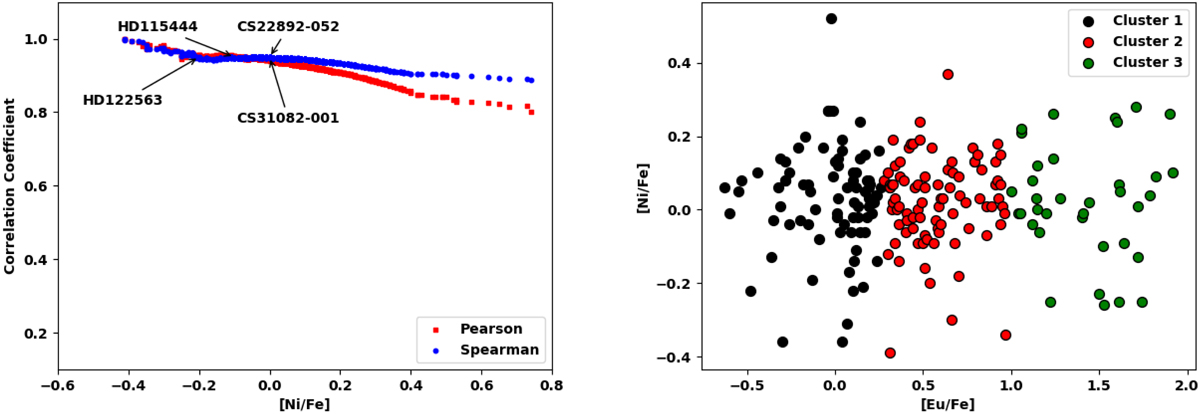
Correlation methods against clustering. Left panel: PCCs and SCCs of Fe and Ni in stars with [Fe/H] < −2.5. We see a high correlation for the whole Ni/Fe range, including limited-r as well a r-I and r-II stars, as indicated by the four sample stars. Right panel: Eu/Fe, ranging over three orders of magnitude for all Milky Way stars with [Fe/H] < −2.5. While we see the [Eu/Fe] values grouped in three clusters in a (k-means) three cluster plot, divided in limited-r stars, r-I, and r-II stars, the Ni/Fe ratios display no correlation with [Eu/Fe].
Current usage metrics show cumulative count of Article Views (full-text article views including HTML views, PDF and ePub downloads, according to the available data) and Abstracts Views on Vision4Press platform.
Data correspond to usage on the plateform after 2015. The current usage metrics is available 48-96 hours after online publication and is updated daily on week days.
Initial download of the metrics may take a while.