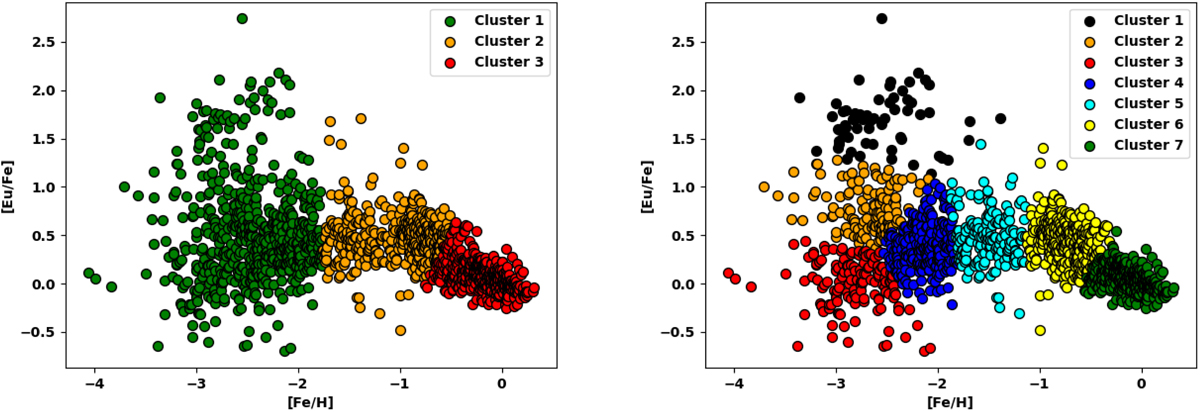
Fig. 4.
Download original image
Clustering of star abundances. Left panel: [Eu/Fe] ratios as in Fig. 2 (left panel), but divided into three k-means clusters, coinciding with increasing correlation strengths in Table 4 and the appearance of spurious correlations. Right panel: if we choose to divide into seven clusters, intermediate transition clusters appear in the interval −2.5 < [Fe/H] < −1, where an increasingly higher number of different r-process events tends to result in a change to an average [Eu/Fe] value, before around the kink at [Fe/H] = −1 the domination of core-collapse supernovae turns over to a type Ia supernova domination. For [Fe/H] < −2.5 we see the division in limited-r, r-I, and r-II stars, showing that they indicate different abundance behaviors.
Current usage metrics show cumulative count of Article Views (full-text article views including HTML views, PDF and ePub downloads, according to the available data) and Abstracts Views on Vision4Press platform.
Data correspond to usage on the plateform after 2015. The current usage metrics is available 48-96 hours after online publication and is updated daily on week days.
Initial download of the metrics may take a while.