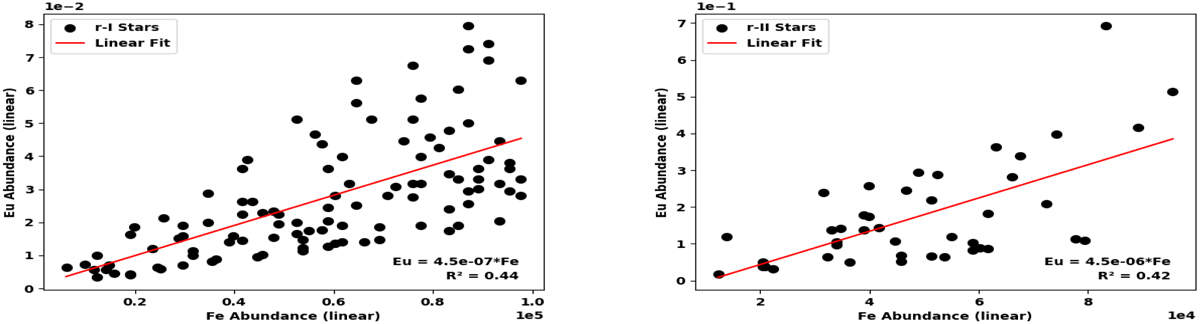
Fig. 20.
Download original image
Relationship between Fe and Eu abundances for r-I and r-II stars. Left panel: Eu abundances versus Fe for r-I stars. Right panel: Eu abundances versus Fe for r-II stars. The PCC values of 0.66 and 0.64, corresponding to the displayed r2’s underline a moderate correlation for both star types. The determined mean Eu/Fe ratios will be utilized in Sect. 6.3.2.
Current usage metrics show cumulative count of Article Views (full-text article views including HTML views, PDF and ePub downloads, according to the available data) and Abstracts Views on Vision4Press platform.
Data correspond to usage on the plateform after 2015. The current usage metrics is available 48-96 hours after online publication and is updated daily on week days.
Initial download of the metrics may take a while.