Fig. 16.
Download original image
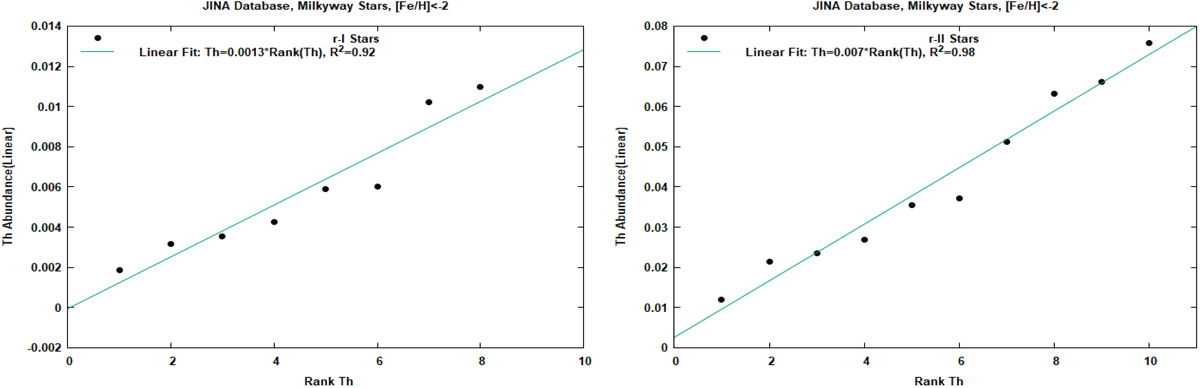
Th behavior with ranks. Left panel: Th abundances plotted versus their ranks for r-I stars. Right panel: Th abundances plotted versus their ranks for r-II stars. We find a linear relation for each of these two groups, pointing to unique r-process sources for these two regimes, while the global plot of Th abundances versus their ranks in Fig. 10 (right panel) indicated a superposition of events.
Current usage metrics show cumulative count of Article Views (full-text article views including HTML views, PDF and ePub downloads, according to the available data) and Abstracts Views on Vision4Press platform.
Data correspond to usage on the plateform after 2015. The current usage metrics is available 48-96 hours after online publication and is updated daily on week days.
Initial download of the metrics may take a while.