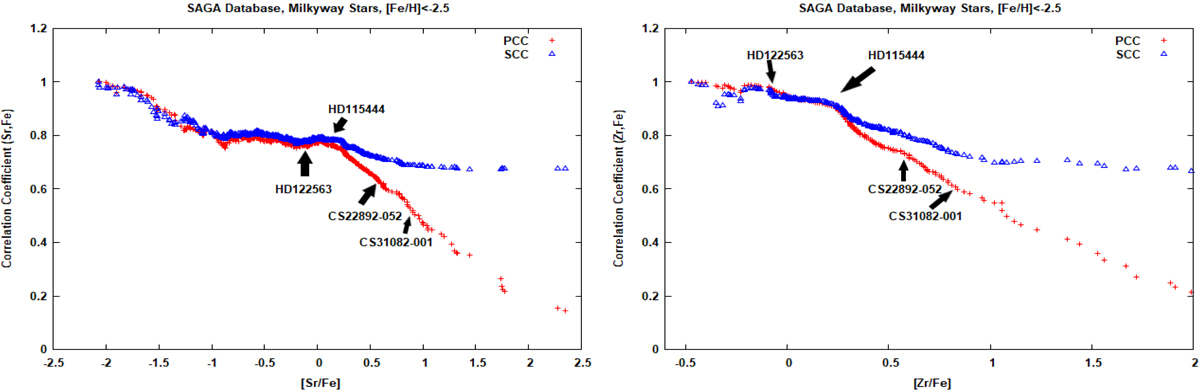
Fig. 13.
Download original image
Comparison of correlation methods for Sr and Zr. Left panel: PCCs and SCCs of Fe with Sr in stars with [Fe/H] < −2.5. Right panel: PCCs and SCCs of Fe with Zr in stars with [Fe/H] < −2.5. Y (not shown here) behaves in a similar way. Contrary to Fig. 3 (right panel) also stars with lower [Sr,Y,Zr/Fe] values than those with a weak r-process signature, such as HD 122563, are observed. HD 115444, CS22892−052, and CS31082−001 appear in the same order as seen in their increasing r-process strength.
Current usage metrics show cumulative count of Article Views (full-text article views including HTML views, PDF and ePub downloads, according to the available data) and Abstracts Views on Vision4Press platform.
Data correspond to usage on the plateform after 2015. The current usage metrics is available 48-96 hours after online publication and is updated daily on week days.
Initial download of the metrics may take a while.