Fig. 3
Download original image
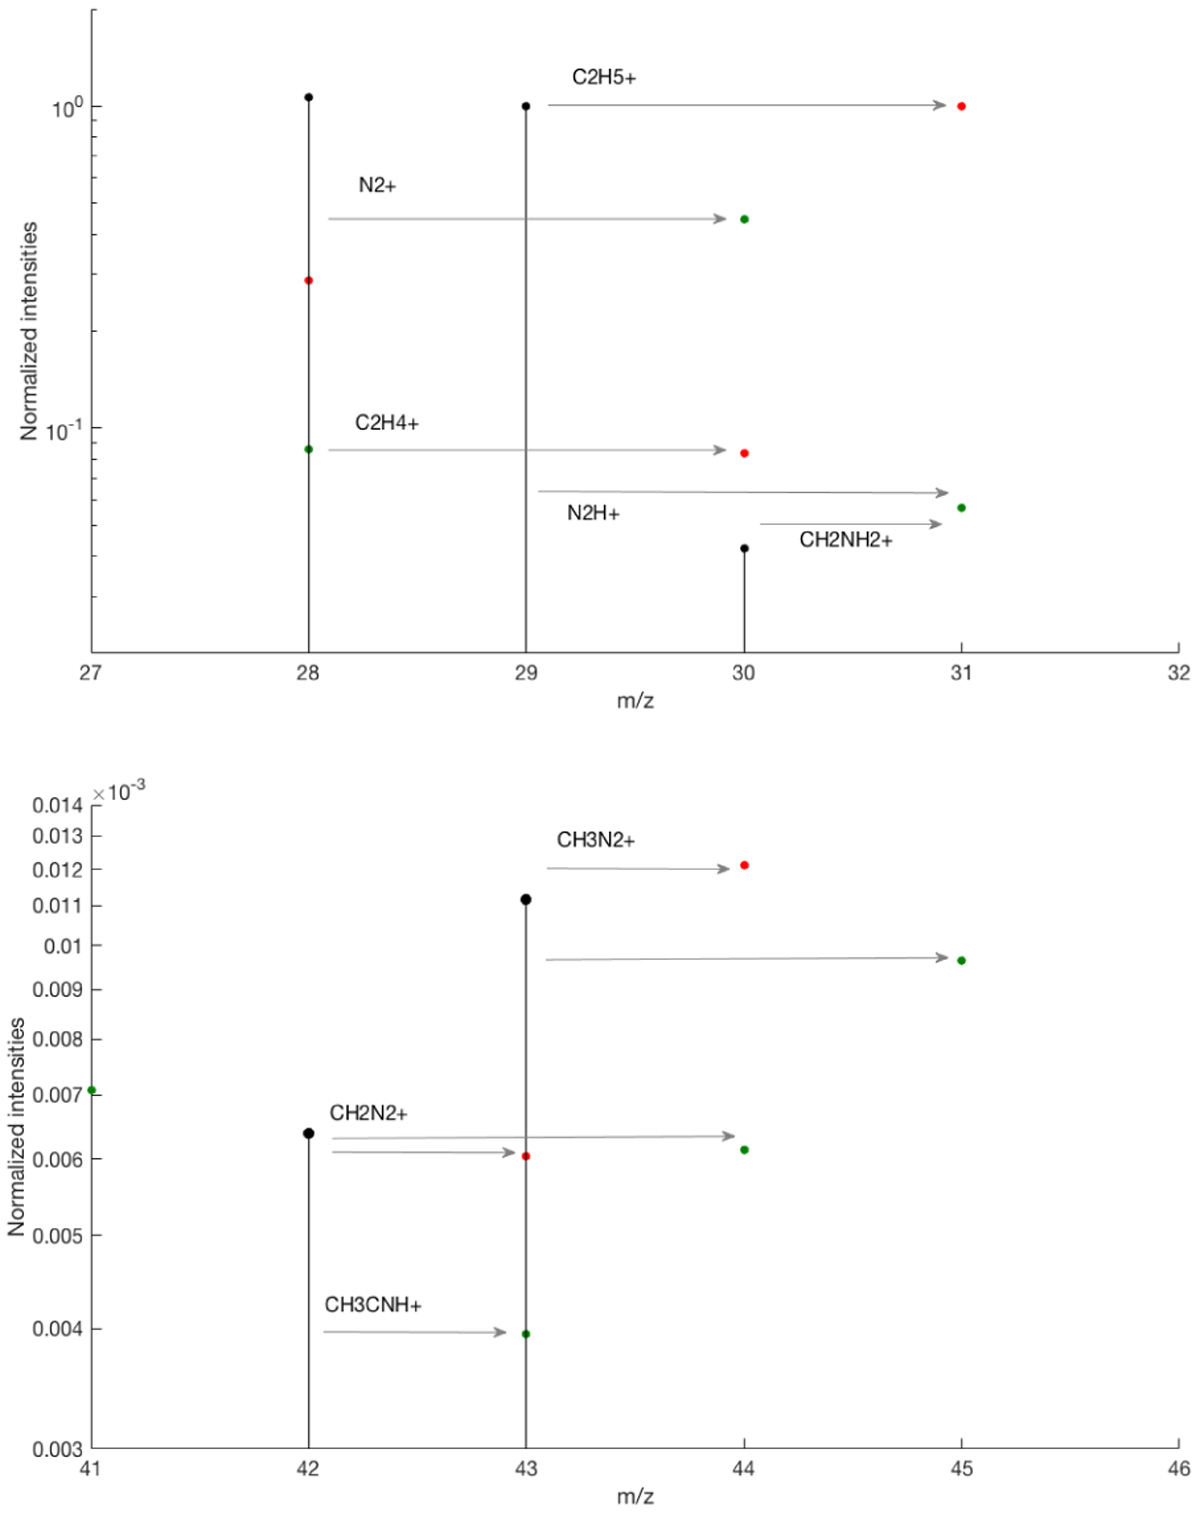
(black) Positive ion spectra of the three regular experiments normalized to the peak at m/z 29, and compared to the same experiments lead with isotopic gases: (red) 13CH4, and (green) with 15N15N. The upper panel corresponds to the mass range 27–32 u (C2 block), whereas the lower panel corresponds to the mass range 41–46 u (C3 block).
Current usage metrics show cumulative count of Article Views (full-text article views including HTML views, PDF and ePub downloads, according to the available data) and Abstracts Views on Vision4Press platform.
Data correspond to usage on the plateform after 2015. The current usage metrics is available 48-96 hours after online publication and is updated daily on week days.
Initial download of the metrics may take a while.