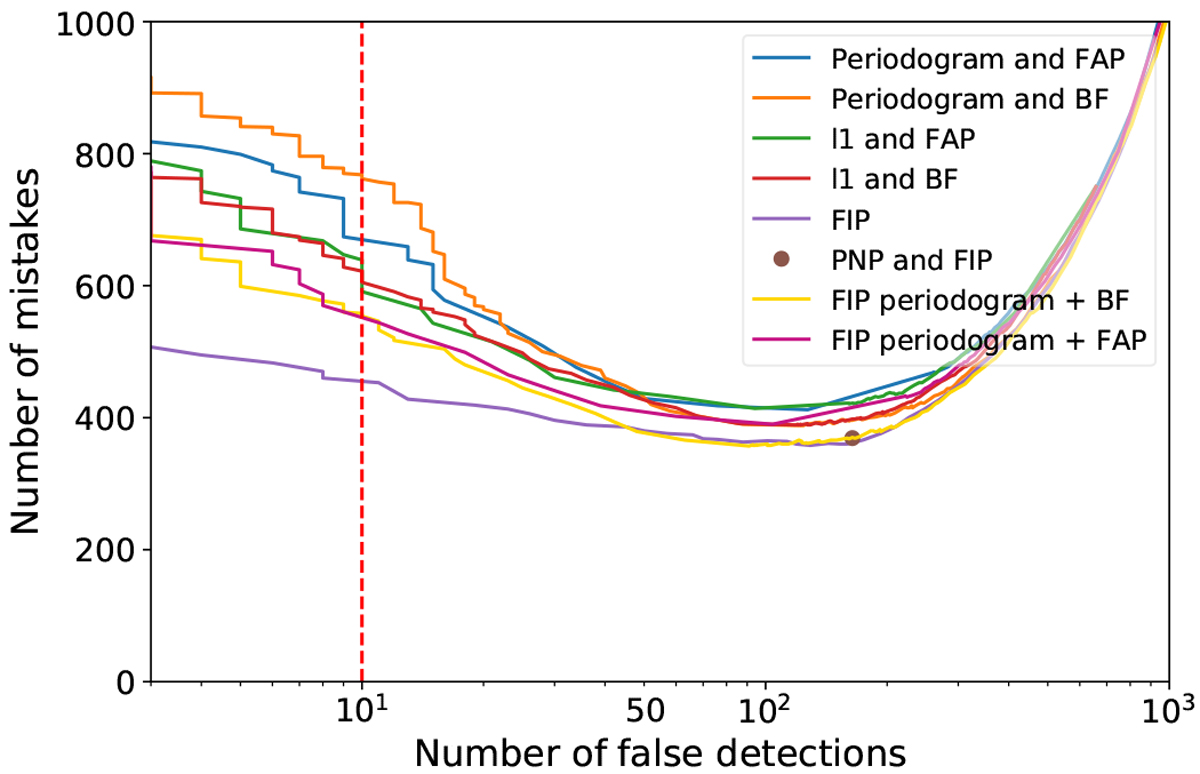
Fig. 9
Download original image
Number of mistakes as a function of the number of false detections (log scale) for the different detection methods. The data corresponds to simulation 2 (see Sect. 6.2.5): a random number of planets equal to 0, 1, or 2 planets per system; white and correlated noise. This simulation has a timescale of 4 days and an amplitude of 1 m s−1. The semi-amplitude to noise level ratio of 1.7. Mistakes are defined as the sum of missed and false detections.
Current usage metrics show cumulative count of Article Views (full-text article views including HTML views, PDF and ePub downloads, according to the available data) and Abstracts Views on Vision4Press platform.
Data correspond to usage on the plateform after 2015. The current usage metrics is available 48-96 hours after online publication and is updated daily on week days.
Initial download of the metrics may take a while.