Fig. C.1
Download original image
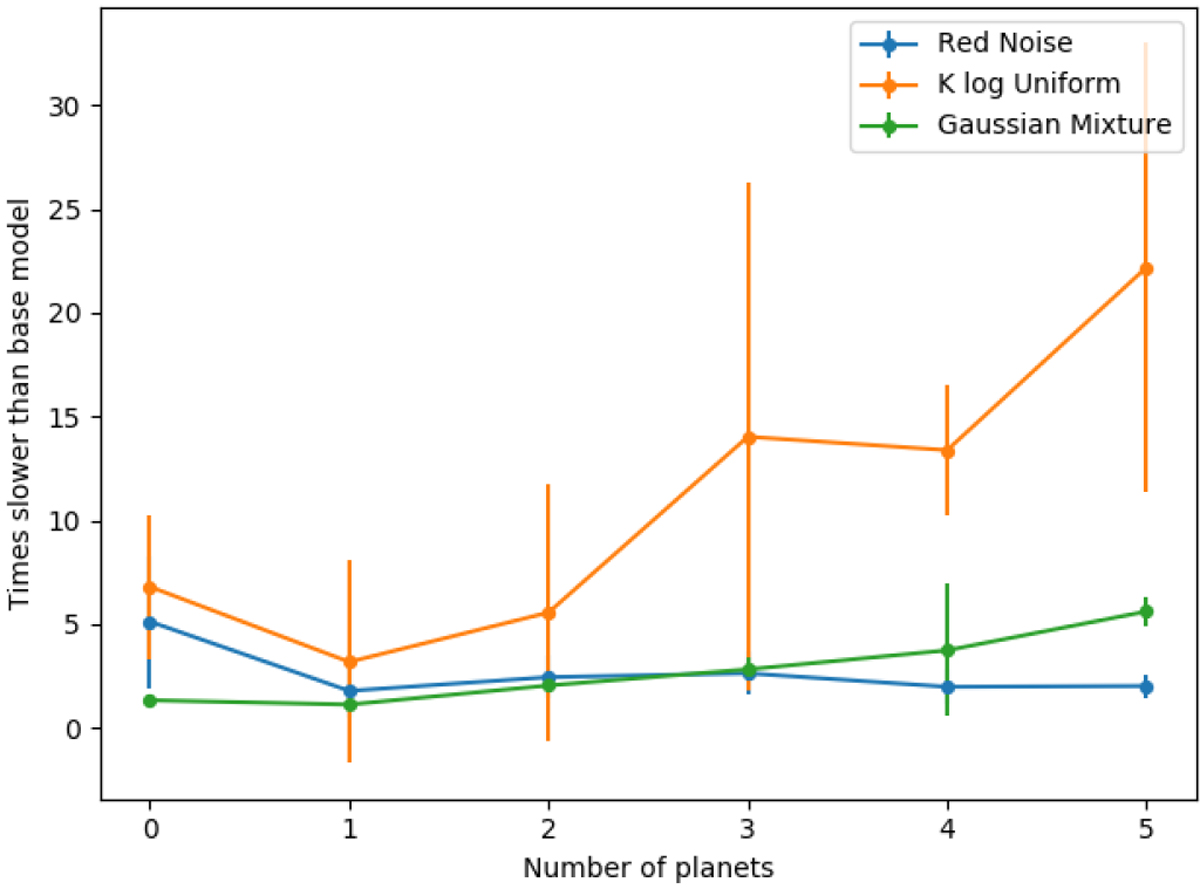
Runtime comparisons with different assumptions on the model. Plotted are the red noise (blue), log Uniform prior on Κ (orange), and Gaussian mixture prior (green). The y-axis shows the ratio of the average time of the indicated configuration to the average time of the base model. Five independent runs were performed with each number of planets; the mean time is represented with plain lines and the standard deviation is represented as error bars.
Current usage metrics show cumulative count of Article Views (full-text article views including HTML views, PDF and ePub downloads, according to the available data) and Abstracts Views on Vision4Press platform.
Data correspond to usage on the plateform after 2015. The current usage metrics is available 48-96 hours after online publication and is updated daily on week days.
Initial download of the metrics may take a while.