Fig. 11
Download original image
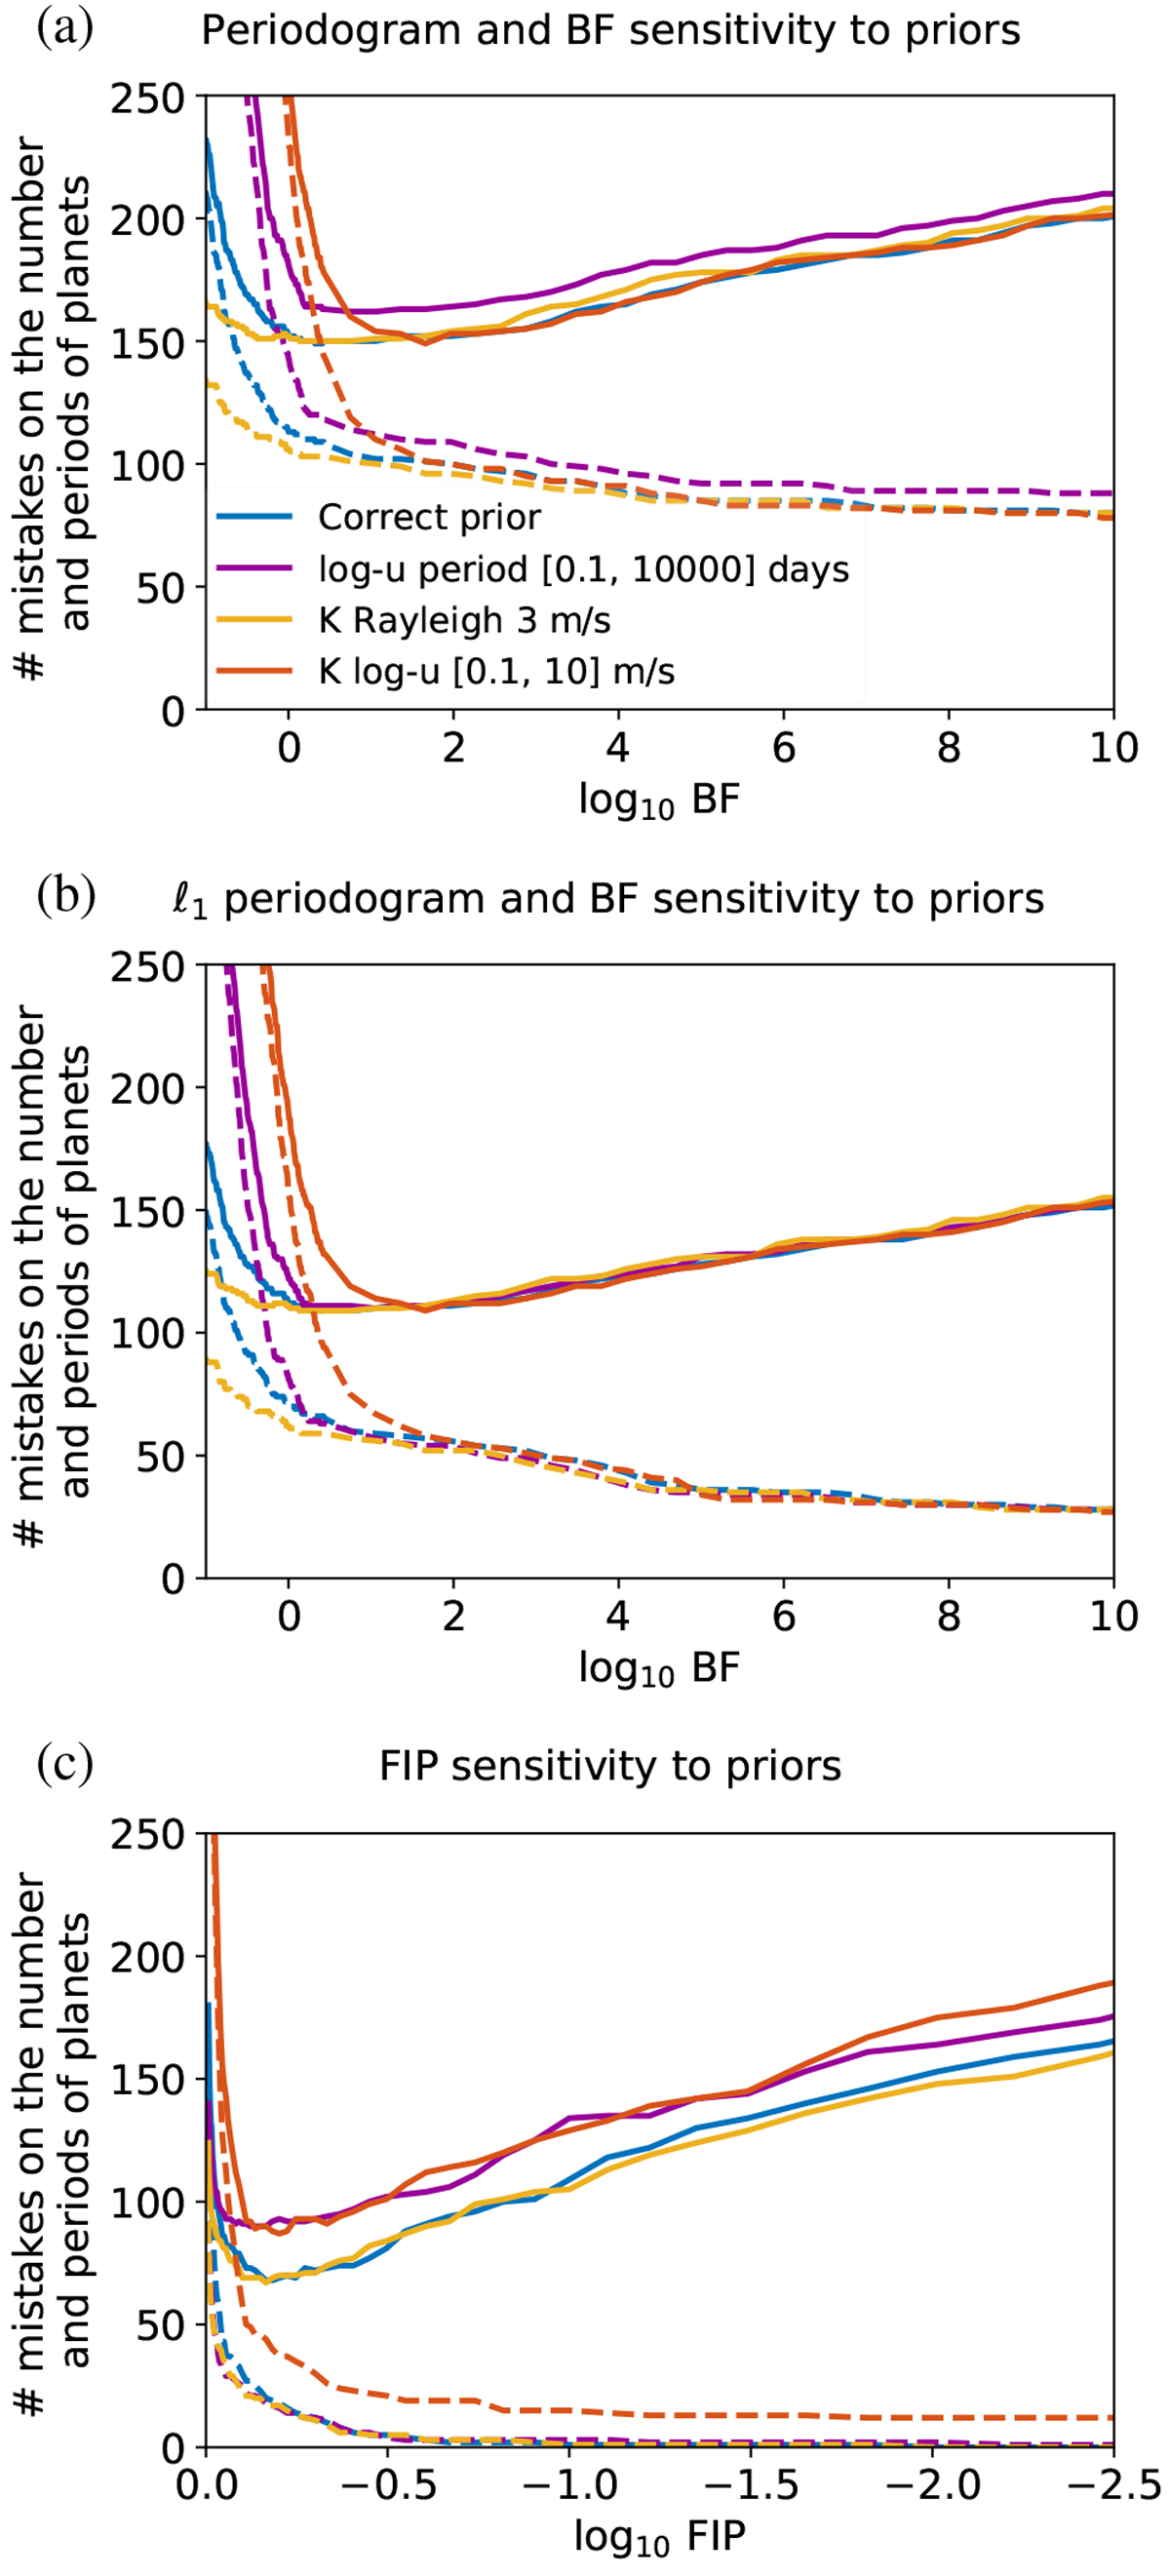
Total number of mistakes (plain line) and total number of false detections (dashed lines) on 1000 simulated systems as a function of the threshold (from top to bottom: periodogram + BF, ℓ1 periodogram and BF, FIP) for different assumptions on the priors (see Sect. 6.3). In blue: correct priors (1.5–100 days log-uniform in period Rayleigh with σ = 1.5 ms−1 on K); in purple: 1.5–10 000 days log-uniform in period; in yellow: Rayleigh with σ = 3m s−1 on K; in red: log-uniform on [0.1, 10] m s−1 on K. The dashed lines represent the number of false detections as a function of the detection threshold and plain lines represent the total number of mistakes (false and missed detection) as a function of the threshold.
Current usage metrics show cumulative count of Article Views (full-text article views including HTML views, PDF and ePub downloads, according to the available data) and Abstracts Views on Vision4Press platform.
Data correspond to usage on the plateform after 2015. The current usage metrics is available 48-96 hours after online publication and is updated daily on week days.
Initial download of the metrics may take a while.