Fig. 10
Download original image
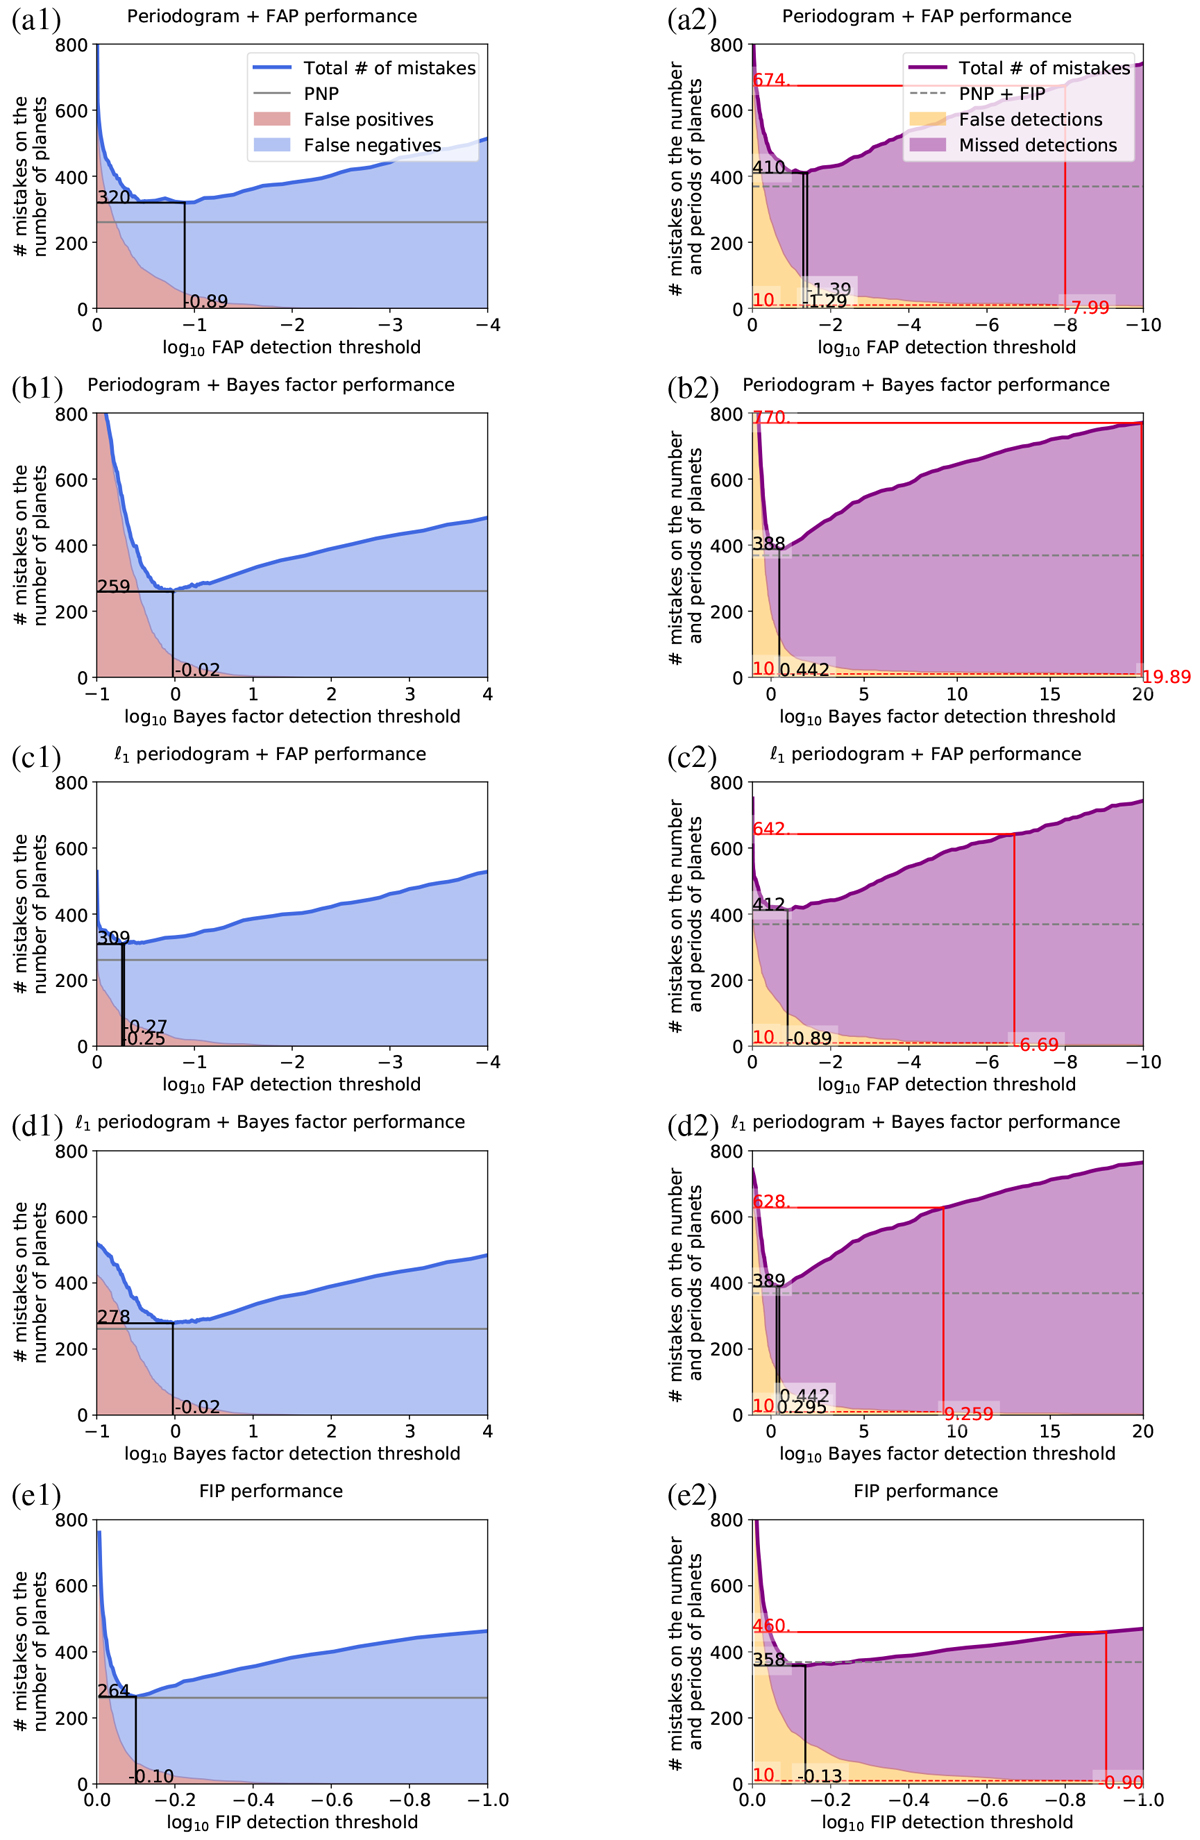
Total number of mistakes on the number of planets (left) and number and period of planets (right) out of 1000 datasets with correlated noise (simulation 2, see Sect. 6.2.5) as a function of the detection threshold for different statistical significance metrics. From top to bottom: Periodogram + FAP, Periodogram + Bayes factor, ℓ1 periodogram + FAP and FIP. The total number of false positives and false negatives are represented in light red and blue shaded areas. The false and missed detections are represented in orange and purple shaded areas, respectively. The minimum and maximum values of the detection threshold corresponding to the minimum number of mistakes are marked with black lines.
Current usage metrics show cumulative count of Article Views (full-text article views including HTML views, PDF and ePub downloads, according to the available data) and Abstracts Views on Vision4Press platform.
Data correspond to usage on the plateform after 2015. The current usage metrics is available 48-96 hours after online publication and is updated daily on week days.
Initial download of the metrics may take a while.