Free Access
Fig. 1
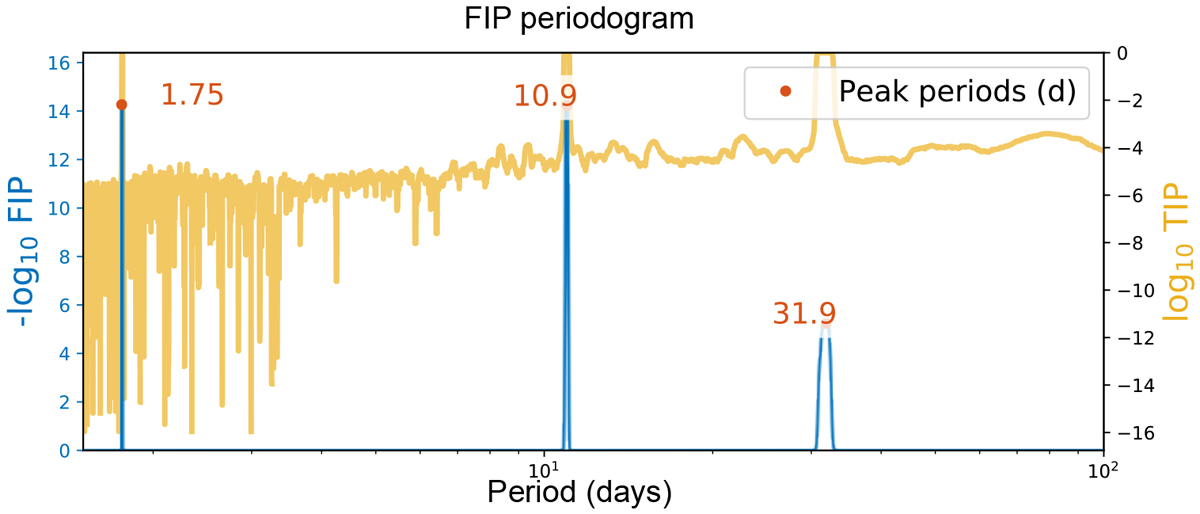
Download original image
FIP periodogram of a simulated system with three injected planets. The periods of the peaks are indicated by red points; the −log10FIP and log10TIP are represented as a function of the centre of the period interval considered, in blue and yellow, respectively.
Current usage metrics show cumulative count of Article Views (full-text article views including HTML views, PDF and ePub downloads, according to the available data) and Abstracts Views on Vision4Press platform.
Data correspond to usage on the plateform after 2015. The current usage metrics is available 48-96 hours after online publication and is updated daily on week days.
Initial download of the metrics may take a while.