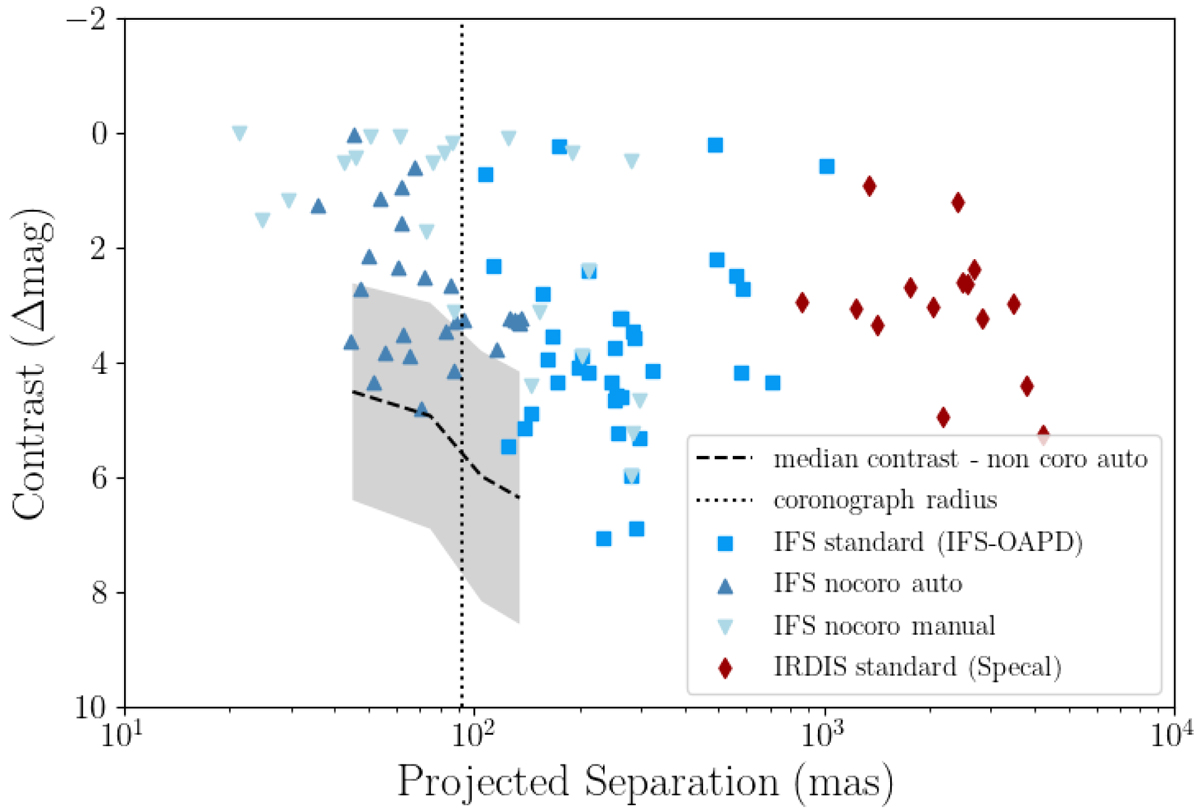
Fig. 5.
Download original image
Contrast (in Δmag) vs. projected separation of all the detected companions. The different plot symbols reflect the various reduction methods described in Sect. 3. The dotted line marks the position of the edge of the coronagraph. The average contrast obtained for the automatic detections on non-coronagraphic observations is shown for comparison (black dashed line; see Sect. 3.3 for details). The shaded area marks a 1σ boundary around it. The corresponding limit for the standard reduction would be below the plot limits. We note that objects with multiple epochs will appear more than once if different reduction methods were used.
Current usage metrics show cumulative count of Article Views (full-text article views including HTML views, PDF and ePub downloads, according to the available data) and Abstracts Views on Vision4Press platform.
Data correspond to usage on the plateform after 2015. The current usage metrics is available 48-96 hours after online publication and is updated daily on week days.
Initial download of the metrics may take a while.