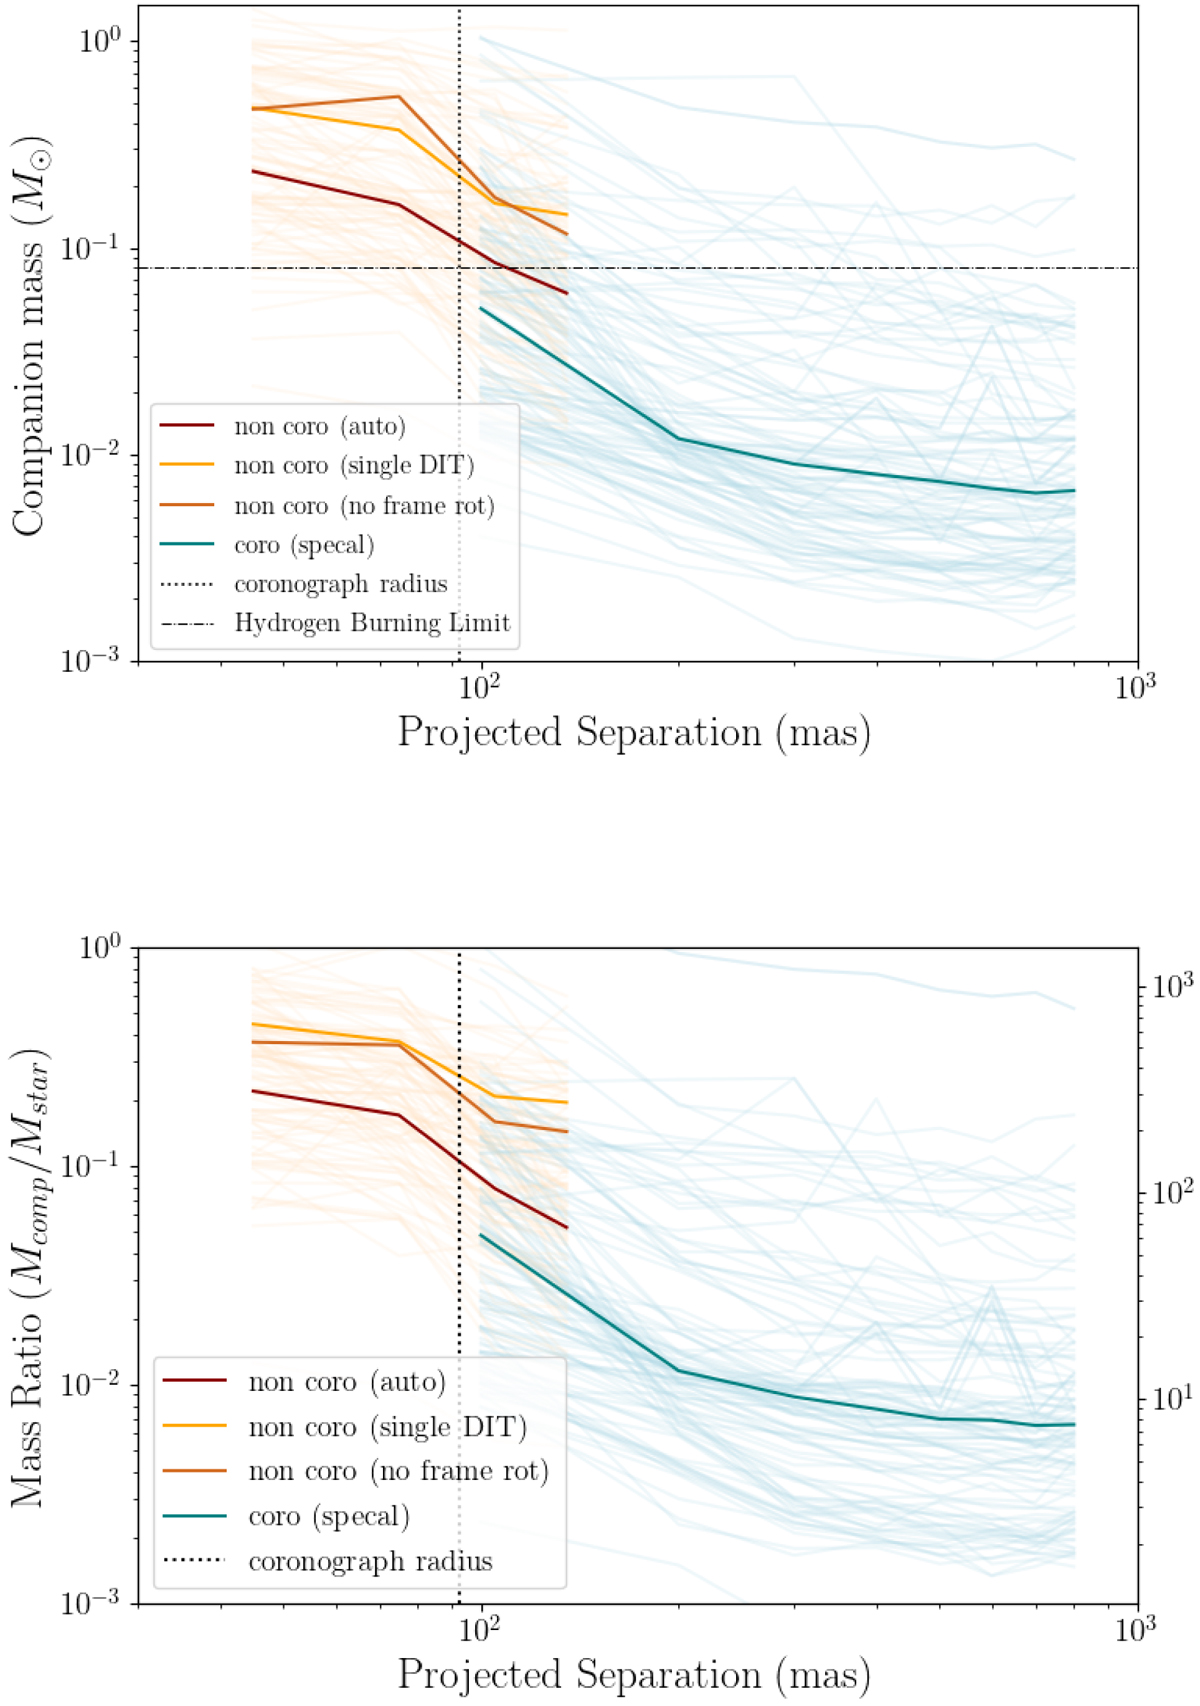
Fig. 3.
Download original image
Minimum mass (top panel) and mass ratio (bottom panel) vs. projected separation of companions detectable in the coronagraphic (blue lines) and non-coronagraphic (yellow lines) images, obtained using the COND evolutionary models (Baraffe et al. 2003) to convert the magnitude limits in Fig. 2. The solid lines show the median contrast obtained with the various methods described in Sect. 3.4. The dashed vertical line marks the coronagraphic radius. The dotted-dashed line in the top panel marks the hydrogen burning limit. We note that objects with multiple epochs will appear more than once.
Current usage metrics show cumulative count of Article Views (full-text article views including HTML views, PDF and ePub downloads, according to the available data) and Abstracts Views on Vision4Press platform.
Data correspond to usage on the plateform after 2015. The current usage metrics is available 48-96 hours after online publication and is updated daily on week days.
Initial download of the metrics may take a while.