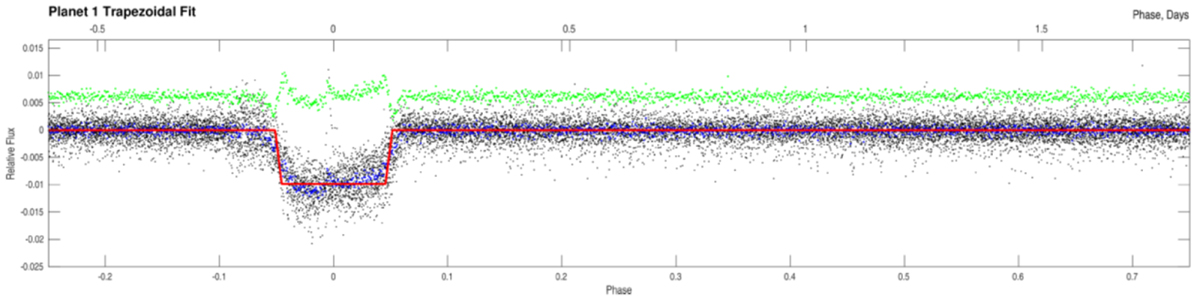
Fig. B.6.
Download original image
Results from the SPOC analysis of TESS data for TYC 8332-2024-1. Black dots are the pre-whitened TESS photometry phased at a period of 2.417 d; blue dots are running median values. The red line is a trapezoidal transit model. The green points are residuals. The large offset between in transit-off transit position suggests that this feature is due to a background star and not to TYC 8332-2024-1
Current usage metrics show cumulative count of Article Views (full-text article views including HTML views, PDF and ePub downloads, according to the available data) and Abstracts Views on Vision4Press platform.
Data correspond to usage on the plateform after 2015. The current usage metrics is available 48-96 hours after online publication and is updated daily on week days.
Initial download of the metrics may take a while.