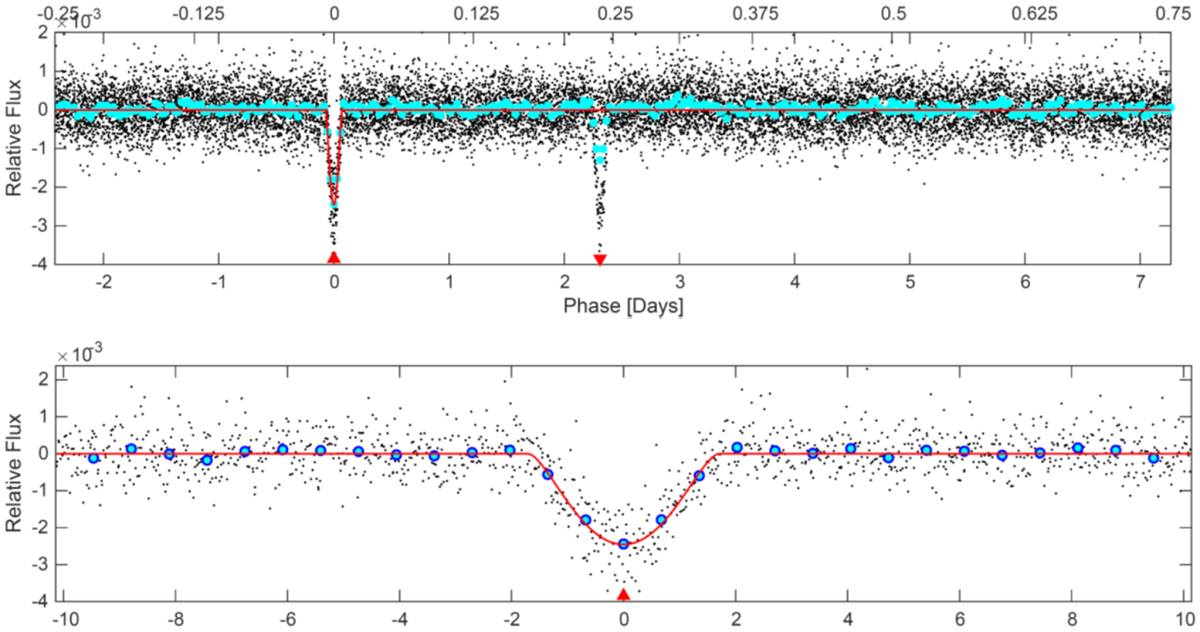
Fig. B.4.
Download original image
Results from the SPOC analysis of TESS data for HIP70833. Black dots are the pre-whitened TESS photometry re-phased at a period of 9.689 d (black dots). Blue dots are running median values. The red line is a transit model. The red triangles mark the primary and secondary transits. Upper panel: full data set. Lower panel: Blow up of the primary transit.
Current usage metrics show cumulative count of Article Views (full-text article views including HTML views, PDF and ePub downloads, according to the available data) and Abstracts Views on Vision4Press platform.
Data correspond to usage on the plateform after 2015. The current usage metrics is available 48-96 hours after online publication and is updated daily on week days.
Initial download of the metrics may take a while.