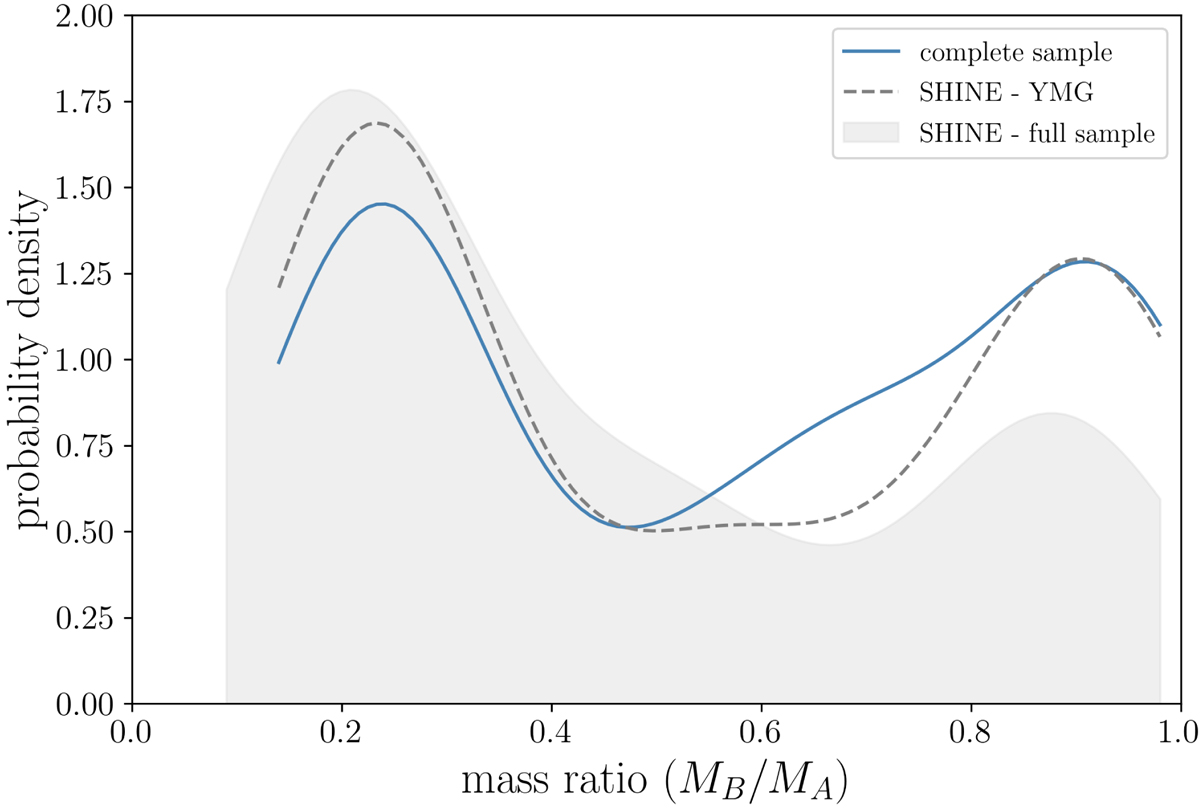
Fig. 14.
Download original image
Mass ratio distribution obtained using the kernel density estimate (KDE) method (see e.g. Silverman 1986) and a Gaussian kernel with σ = 0.1. The solid blue line shows the result obtained for the systems in the complete sample described in Sect. 5.1 including the additional objects from Table 7, weighted according to their probability of being observed (see Sect. 5.1 for details). The grey shaded area shows the distribution obtained using the full sample of SHINE binaries from this work, while the dashed grey line shows the distribution obtained using only the SHINE young moving group systems included in the complete sample.
Current usage metrics show cumulative count of Article Views (full-text article views including HTML views, PDF and ePub downloads, according to the available data) and Abstracts Views on Vision4Press platform.
Data correspond to usage on the plateform after 2015. The current usage metrics is available 48-96 hours after online publication and is updated daily on week days.
Initial download of the metrics may take a while.