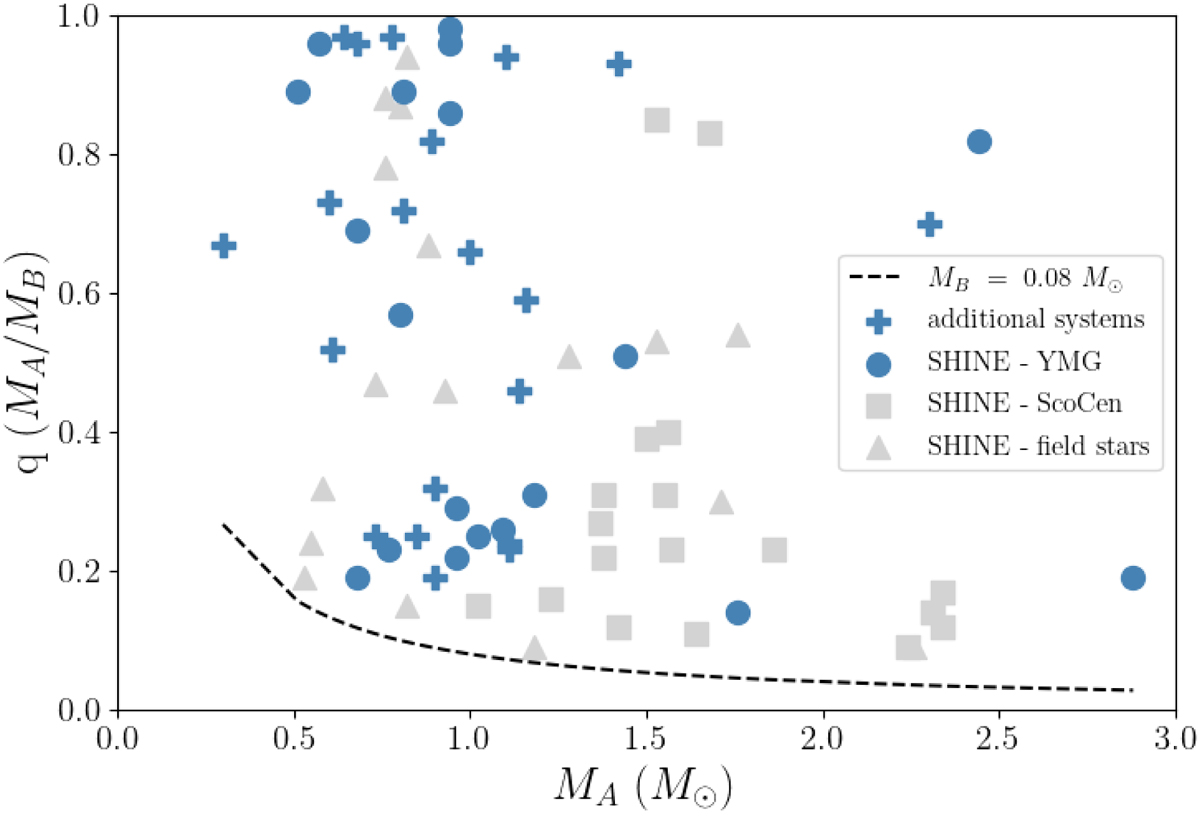
Fig. 12.
Download original image
Primary mass (MA) vs. mass ratio (MB/MA) for binaries in our reduced sample. The light grey squares and triangles show the position of the binaries in ScoCen and in the field excluded from the reduced sample, respectively. The plus signs show the position of the additional systems from Table 7. The dashed line shows the position of the hydrogen burning limit (MB = 0.08M⊙).
Current usage metrics show cumulative count of Article Views (full-text article views including HTML views, PDF and ePub downloads, according to the available data) and Abstracts Views on Vision4Press platform.
Data correspond to usage on the plateform after 2015. The current usage metrics is available 48-96 hours after online publication and is updated daily on week days.
Initial download of the metrics may take a while.