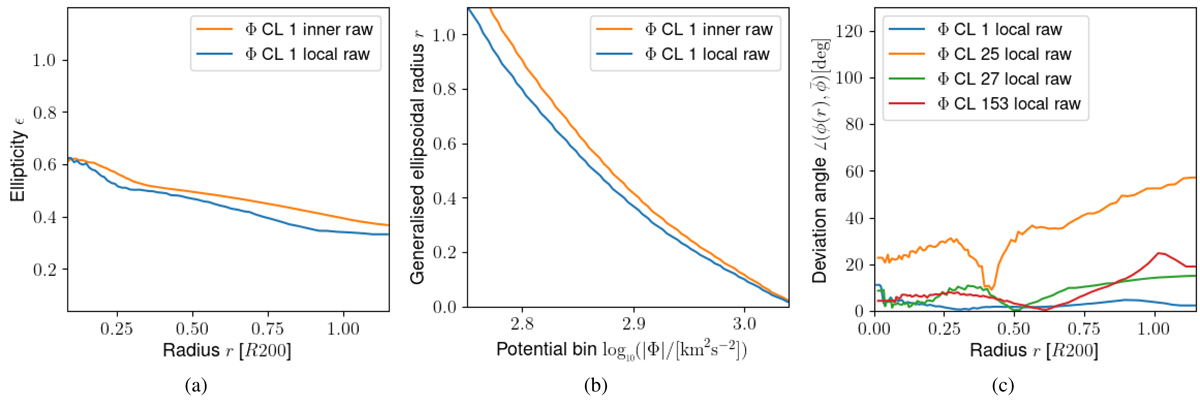
Fig. 9.
Download original image
Individual cluster result examples for the gravitational potential, showing the same random set of clusters as we used in Fig. 6. These figures are intended for a better illustration only, complementary to our statistical analysis using the full cluster sample. The label ‘raw’ refers to the non-processed original potential data set.
Current usage metrics show cumulative count of Article Views (full-text article views including HTML views, PDF and ePub downloads, according to the available data) and Abstracts Views on Vision4Press platform.
Data correspond to usage on the plateform after 2015. The current usage metrics is available 48-96 hours after online publication and is updated daily on week days.
Initial download of the metrics may take a while.