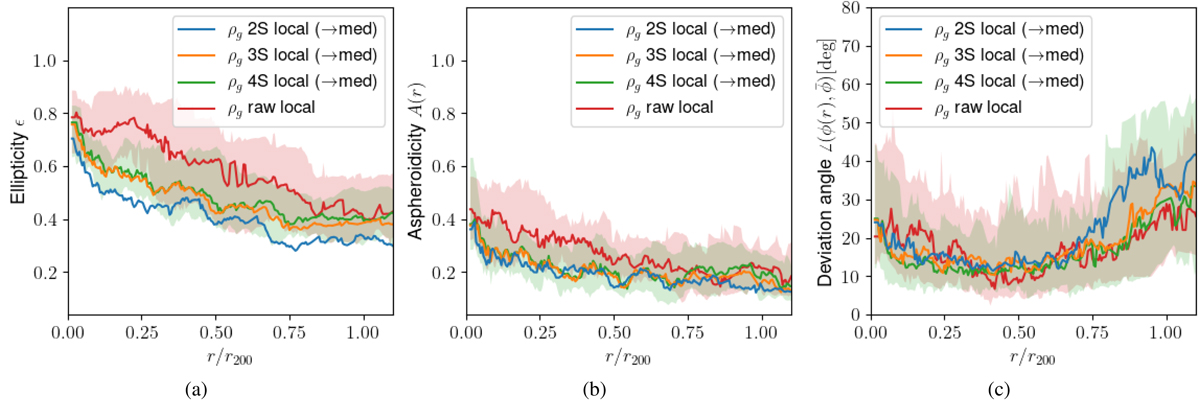
Fig. 7.
Download original image
Comparison between substructure-affected (raw) and various cleaned data sets using different cut parameters (2S, 3S and 4S) for a fixed configuration (e.g. local domain + median method). The semi-transparent areas enclose the quartiles of the cluster sample, shown here only for the raw and the 4S results to avoid a crowded plot. Here, ‘med’ has the same meaning as in Fig. 5.
Current usage metrics show cumulative count of Article Views (full-text article views including HTML views, PDF and ePub downloads, according to the available data) and Abstracts Views on Vision4Press platform.
Data correspond to usage on the plateform after 2015. The current usage metrics is available 48-96 hours after online publication and is updated daily on week days.
Initial download of the metrics may take a while.